
Ch. 5 Financial Statement Analysis
5.2 Analytical Techniques
Learning Objectives
After completing this section, you will be able to:
- Evaluate company performance using horizontal, common-size, and trend analyses.
- Understand the consistency principle.
- Analyze financial statement data to explain changes in key accounts and cash flows.
Analytical Techniques
The raw numbers in financial statements, such as net income, sales revenue, or total assets, by themselves don’t provide much insight. Their significance becomes clear only when compared to other figures. For example, saying a company earned $1 million in net income means little without context. If the company invested only $10 million in capital, that profit looks strong. But if the company has several hundred million invested, $1 million would be considered weak.
To make such comparisons easier, analysts often express relationships as ratios or percentages. For instance, the return (net income of $15,000) on invested capital ($150,000) could be expressed as $15,000 ÷ $150,000 = 10%. A ratio between sales revenue ($150,000) and inventory ($20,000) could be expressed as 7.5:1, or 750%.
Changes in financial data over time are often shown as percentages as well. For example, if sales increased from $40,000 last year to $48,000 this year, the $8,000 increase represents a 20% growth ($8,000/$40,000). However, not all changes are meaningful. A move from a $4,000 loss to $20,000 in profit may look like a large jump, but expressing it as a percentage would be misleading. Similarly, if a company had no debt securities last year but shows $15,000 this year, the increase can’t be expressed as a percentage change in a useful way.
To better evaluate performance over time, analysts often use horizontal analysis, which compares financial results across two or more years to identify improvements, declines, or trends. By contrast, common-size analysis examines the composition of financial data within a single year.
Horizontal Analysis
The most common type of horizontal analysis is comparative financial statement analysis, where results from two or more years are compared. Both dollar changes and percentage changes are calculated relative to a base year. This technique helps highlight patterns, growth, or declines in key financial measures.
For example, The Walt Disney Company (Disney) financial statements from 2023 and 2024 (shown in Exhibits 13-2, 13-3, and 13-4) demonstrate how these calculations are applied and how various analytical techniques are used in practice.
Analyzing Financial Statements
When reviewing financial statements, analysts usually focus on large or significant changes, whether shown in absolute dollar amounts or percentages. While percentage changes can highlight important trends, they can also be misleading if the base amount is very small.
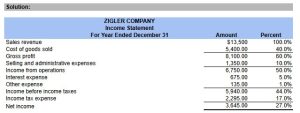
Income Statement Analysis
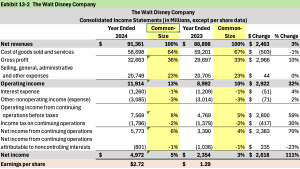
For example, Disney reported Net income <loss> from continuing operations attributable to noncontrolling interests improved from < $1,036> million in 2023 to <$801> million in 2024 (Exhibit 13-2). This represents an improvement of 23%, but the absolute improvement of $235 million is relatively minor compared to much larger figures elsewhere in the income statement.
Because of this, analysts are advised to first examine changes in key totals, such as:
- Sales revenue
- Operating income
- Net income
- Total assets
- Total liabilities
A particularly notable trend is Disney’s Net income, which increased $2,618, or 111% between 2023 and 2024. Much of this improvement was due to an increase in Net revenues as seen in as an increase of $2,463 million.
This kind of analysis illustrates how both percentage changes and dollar amounts must be considered together to gain an accurate picture of a company’s financial performance.
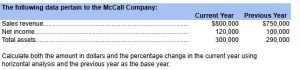
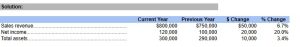
Horizontal Analysis Example:
Common-Size Statements
Concept: Common-size analysis allows us to evaluate the relationships among items in the income statement and balance sheet, and to compare them to prior years.
Method:
- Each income statement item is expressed as a percentage of total sales revenue.
- Each balance sheet item is expressed as a percentage of total assets.
When prepared in this way, financial statements are referred to as common-size statements.
Assessment:
The resulting percentages highlight year-to-year differences. Analysts can then investigate significant changes to understand what caused them. For example, an increase in selling expenses might signal higher marketing efforts, while a drop in gross profit margin could suggest cost pressures or pricing challenges.
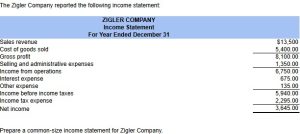
Common-Size Example:
Balance Sheet Analysis
Analysts should investigate significant changes in individual items like accounts receivable, inventory, or property, plant, and equipment. For instance, Disney’s total assets decreased 5% from 2023 to 2024 (Exhibit 13-3), while net revenues increased 3% over the same period (Exhibit 13-2). When you look at the change in assets from 2023 to 2024, you note the majority of the decrease in assets relates to a decrease in Cash and cash equivalents from 2023 to 2024.
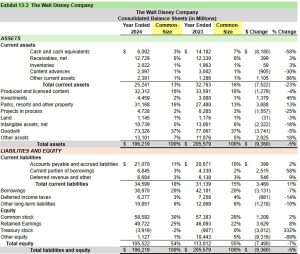
Exhibit 13-3 presents Disney’s consolidated balance sheets for 2023 and 2024. Reviewing the statement of cash flows (Exhibit 13-4) helps explain these changes. Between 2023 and 2024, Disney generated higher cash flow from operations, however, spent more on property, plant and equipment, paid down outstanding liabilities and invested more in noncontrolling interests. These activities caused a net decrease in cash of $8,180 million, or 58%.
Cash Flow Analysis
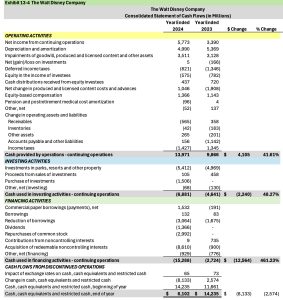
Exhibit 13-4 shows Disney’s consolidated statement of cash flows for 2023 and 2024. The data reveal several important changes:
- Operating activities: Net cash provided by operations rose from $9,866 million in 2023 to $13,971 million in 2024, an increase of 41.61%. This reflects stronger earnings and improvements in working capital management.
- Investing activities: Net cash used in investing increased, mainly due to higher spending on parks, resorts and other property of $5,412 million and an increase of investment of $1,506 million.
- Financing activities: Net cash outflows from financing jumped from $2,724 million in 2023 to $15,288 million in 2024. This was largely the result of the acquisition of redeemable noncontrolling interests and paydown of outstanding borrowings.
- Net change in cash: Overall, cash and cash equivalents decreased by $8,133 million, compared to a decrease of $2,574 million increase the year before.
This shows that Disney’s stronger operating cash flow has allowed additional revenue-producing investments and pay down of some liabilities.
Consistency Principle
Horizontal analysis, which compares financial data across two or more years, depends on consistent accounting methods. The consistency principle ensures that companies apply the same accounting methods from one period to the next, unless a change is necessary. This allows analysts to interpret differences in reported amounts as real economic changes rather than accounting adjustments.
If a firm changes methods, it must disclose the switch and restate prior financial results as though the new method had always been used. This transparency allows users to clearly separate true business performance from accounting effects.
Trend Analysis
To study performance over longer periods, analysts calculate trend percentages. These track changes in key financial data across five or even ten years. Many companies include such summaries in their annual reports.
For example, instead of just comparing Disney’s results for 2023 and 2024, an analyst might look at sales and net income trends from 2020 through 2024. Examining these longer-term shifts provides a clearer picture of growth patterns, stability, or emerging risks.
Trend Percentages
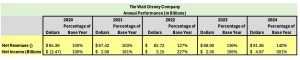
The year-to-year pattern of financial changes can be studied more precisely by calculating trend percentages. This process begins with choosing a base year and then expressing all subsequent years’ data as a percentage of that base year. The base year is always assigned a value of 100%.
For example, if 2020 is chosen as the base year for Disney, then its 2021 through 2024 net sales and earnings from continuing operations are compared to 2020 results. Net sales of $65.39 billion in 2020 are treated as 100%, and all other years’ sales are measured relative to that. Likewise, Disney’s 2020 net loss of $2.47 billion becomes the 100% benchmark for measuring subsequent years’ earnings.
The five-year trend data show two different stories:
- Net sales followed a steady upward trend from 2020 through 2024.
- Net income improved consistently from 2020 to 2024.
This illustrates how trend analysis can highlight fluctuations in financial performance over time.
Choosing the Base Year
When using trend percentages, it is critical to select a representative base year. If the base year was unusual (e.g., perhaps due to one-time gains or losses) it could distort the analysis. For that reason, analysts should avoid picking an abnormal year as the foundation for long-term comparisons.
Additional Trend Data
Beyond net sales and earnings, analysts often look at other financial items across multiple years, such as:
- Total assets
- Investments in property, plant, and equipment
- Cash flow from operations
By examining these trends, analysts gain deeper insight into a company’s long-term financial strength and growth patterns.
Homework 5.2: Better Call Saul LLP, Analytical Detective
Background:
Saul Goodman has opened Better Call Saul LLP, and the financials are rolling in. But raw numbers don’t mean much without context. You’ve been hired as his “forensic accounting sidekick” (think: Jesse Pinkman with a calculator). Your job is to dig into the data using analytical techniques including horizontal analysis, common-size statements, and trend percentages, to see if Saul’s firm is headed for legal victory or financial disaster.
Financial Data (in $000s)
| Year | Net Revenues | Net Income | Total Assets | Total Liabilities | Stockholders’ Equity |
|---|---|---|---|---|---|
| 2022 | 1,200 | 200 | 2,000 | 1,200 | 800 |
| 2023 | 1,500 | 350 | 2,400 | 1,400 | 1,000 |
| 2024 | 1,800 | 420 | 2,700 | 1,500 | 1,200 |
Required:
-
Raw Numbers Don’t Speak for Themselves
-
Saul tells the jury: “My firm earned $420,000 in 2024. Case closed—I’m rich!”
-
Why is this statement misleading without comparison to other figures like assets, revenues, or prior years? Write a short explanation.
-
-
Horizontal Analysis
-
Calculate the dollar change and percentage change in net revenues and net income from 2022 to 2023 and 2023 to 2024.
-
Identify which change looks more significant: the jump in revenue or the jump in profit?
-
If you were a prosecutor cross-examining Saul, which figure would you emphasize to show “suspicious growth” patterns?
-
-
Common-Size Statements
-
Express net income as a percentage of net revenues for each year (a mini income statement common-size analysis).
-
Express liabilities as a percentage of assets for each year (a mini balance sheet common-size analysis).
-
Interpret: Did Saul become more or less reliant on debt over time?
-
-
Trend Analysis
-
Choose 2022 as the base year (100%).
-
Calculate trend percentages for net revenues and net income in 2023 and 2024.
-
Compare: Is net income growing faster or slower than revenues over the three years?
-
