
Ch. 5 Financial Statement Analysis
5.3 Financial Ratios
Learning Objectives
After finishing this section, you will be able to:
- Interpret key profitability, efficiency, and liquidity ratios to evaluate how effectively a company generates earnings from its operations and resources.
- Compare and benchmark ratios across companies and industries to assess relative performance, identify strengths and weaknesses, and understand how mergers, restructuring, or strategic decisions affect ratio outcomes.
- Analyze the relationships among ratios and apply solvency and shareholder-focused ratios to form conclusions about financial health, credit risk, and shareholder returns.
Ratio Analysis
Earlier chapters introduced a variety of financial analytical techniques including ratios. At this stage, these ratios are grouped according to their purpose and analyzed for interpretation.
Exhibit 13-5
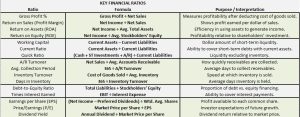
Ratios are typically calculated for a single company, but are often compared to industry competitors to gain perspective. For example, Disney’s financial statements in Exhibits 13-2, 13-3, and 13-4 are used as stand-alone examples regarding the use of analytical techniques. Exhibit 13-5, however, includes a list of financial ratios and their purpose, and are typically applied to two or more companies in the same industry. Ratio calculations below capture financial information for The Walt Disney Company and the Six Flags Entertainment Company. By comparing financial ratios across companies and industries, analysts can better evaluate financial strength and performance of one company compared to other companies.
The following financial ratio discussion is based on the annual 10-k reports for The Walt Disney Company (Walt Disney) and a related company, Six Flags Entertainment Company (Six Flags), for 2023 and 2024.:
Gross Profit Percentage (Gross Margin)
Formula:
Gross Profit Percentage = Gross Profit on Sales ÷ Net Sales
Gross profit, also called gross margin, shows the relationship between net sales and the cost of goods and services sold. It represents the portion of sales revenue left after covering merchandise costs, providing insight into a firm’s pricing strategy and cost control. Gross profit is divided by net sales to express the overall profitability of products and services sold by a company.
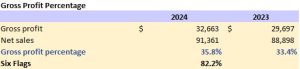
For example, Disney experienced an increase in gross profit percentage from 33.4% in 2023 to 35.8% in 2024. When compared with Six Flags, however, Disney’s margin is lower: Six Flags reported 82.2% in 2024. This type of industry comparison is also known as benchmarking, which highlights differences in efficiency and pricing power on goods and services sold.
Return on Sales (Profit Margin)
Formula:
Return on Sales = Net Income ÷ Net Sales
Return on sales indicates how much profit remains from each dollar of sales after all operating and non-operating expenses are deducted. It effectively matches the net income percentage when common-size income statements are available.
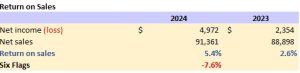
Disney’s return on sales improved significantly, rising from 2.6% in 2023 to 5.4% in 2024, largely due to an increase in overall net sales. Six Flags reported <7.6%> in 2024 due to a merger with Cedar Fair resulting in significant restructuring and integration costs. Consequently, Disney significantly outperformed Six Flags during 2024.
Key Takeaway
- Gross Profit % measures cost efficiency and pricing relative to sales.
- Return on Sales % reflects how much overall profit is generated from sales.
- Both ratios are most useful when comparing across companies in the same industry or across time periods for the same company.
Return on Assets (ROA)
Formula:
Return on Assets = Net Income ÷ Average Total Assets
Return on assets measures overall profitability by showing the percentage of profit earned for each dollar of assets under the company’s control.
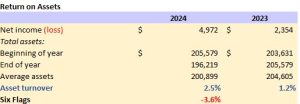
Disney’s return on assets increased from 1.2% in 2023 to 2.5% in 2024, largely due to improved profitability. Six Flags was sharply lower than Disney in 2024 at <3.6%> due to the merger with Cedar Fair.
Return on Equity (ROE)
Formula:
Return on Equity = Net Income ÷ Average Stockholders’ Equity
The return on equity ratio measures how profitable a company is from the perspective of its shareholders. It indicates the percentage of net income earned for every dollar invested by stockholders.
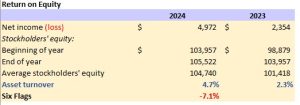
For Disney, return on equity rose significantly from 2.3% in 2023 to 4.7% in 2024. This improvement reflects stronger earnings relative to the company’s equity base. In comparison, Six Flags return on equity is much lower at <7.1%> in 2024 due to negative equity or stockholders’ deficit.
Working Capital
Formula:
Working Capital = Current Assets − Current Liabilities
Working capital is a measure of a company’s short-term financial health, showing whether it has enough current assets to cover current obligations. Positive working capital suggests flexibility in meeting daily operating needs, while negative working capital could indicate liquidity issues.
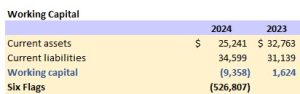
Disney swung from positive $1.6B in 2023 to a working-capital deficit of $9.4B in 2024, driven by lower cash and higher current borrowings and payables. Six Flags shows working-capital deficits in ~$527m deficit in 2024 post-merger. Both companies will need to increase their liquidity over the next year to meet short-term obligations.
Current Ratio
Formula:
Current Ratio = Current Assets ÷ Current Liabilities
The current ratio provides a widely used indicator of a firm’s ability to pay its short-term debts using short-term assets.
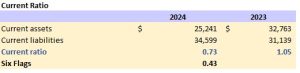
Disney had $0.73 in current assets for every $1 in current liabilities at the end of 2024. While this marks a decline from 2023, it is still above Six Flag’s ratio of 0.43 in 2024.
Historically, a “rule of thumb” suggested a current ratio of 2.0 as a safe benchmark. However, today’s businesses often operate effectively with lower ratios due to better cash flow management and access to short-term financing options like lines of credit. However, a low ratio may also signal potential liquidity risks, while a higher ratio suggests a stronger cushion to cover obligations. Analysts typically compare a company’s ratio both to its past performance and to industry averages.
Quick Ratio
Formula:
Quick Ratio = (Cash and Cash Equivalents + Short-Term Investments + Accounts Receivable) ÷ Current Liabilities
The quick ratio measures a company’s ability to meet its short-term obligations using its most liquid assets, including cash, near-cash investments, and receivables. Unlike the current ratio, it excludes inventory, which may not be easily converted to cash.
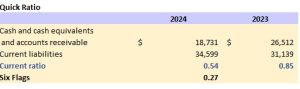
The decline of Disney’s quick ratio from 2023 to 2024 was due to a decrease in cash and equivalents. Compared to Six Flag’s 0.27 in 2024, Disney had a stronger liquidity position.
Accounts Receivable Turnover
Formula:
Accounts Receivable Turnover = Net Sales ÷ Average Accounts Receivable
This ratio measures how quickly a company collects cash from credit sales. A higher turnover indicates faster collection and more efficient use of receivables.
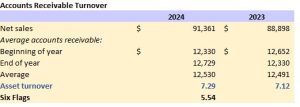
Disney’s improvement from 2023 to 2024 means Disney collected receivables slightly faster in 2024 than in 2023. Six Flags accounts receivable turnover was slower due to a difference in the nature of receivables at Six Flags compared to Disney.
Average Collection Period
Formula:
Average Collection Period = 365 ÷ Accounts Receivable Turnover
This ratio reveals the average number of days it takes for a company to collect payment from customers.
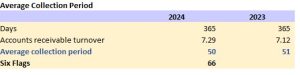
The decrease in Disney’s collection period suggests that customers were paying about the same rate in 2024 as in 2023. Six Flag’s average, however, was 66 days in 2024, which is slower than Disney due to the nature of their receivable balance compared to Disney.
Interpretation
A shorter collection period usually reflects tighter credit policies or improved customer payment behavior, or both. If the collection period becomes too long, however, it could signal weak credit controls or problems with customers’ ability to pay.
Inventory Turnover
Formula:
Inventory Turnover = Cost of Goods Sold ÷ Average Inventory
This ratio shows how efficiently a company manages its inventory by comparing cost of goods sold to average inventory. A higher turnover indicates that goods are sold more quickly, reducing the risk of obsolete or unsellable inventory, while a lower turnover may suggest overstocking or weak sales.
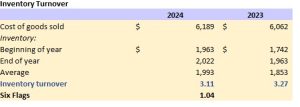
Disney’s turnover was consistent from 2023 to 2024, and faster than Six Flags at 1.04 in 2024.
Days’ Sales in Inventory
Formula:
Days’ Sales in Inventory = 365 ÷ Inventory Turnover
This ratio converts inventory turnover into the average number of days inventory is held before being sold.
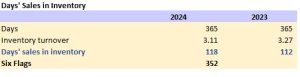
Disney held inventory slightly longer in 2024, however, not as long as Six Flags.
Interpretation
- High turnover usually signals efficient inventory management and strong sales.
- Low turnover may suggest excess inventory, inadequate demand, or overproduction.
- Tracking both inventory turnover and days’ sales in inventory provides a clearer picture of how well a company balances sales demand with inventory levels.
Debt-to-Equity Ratio
Formula:
Debt-to-Equity Ratio = Total Liabilities ÷ Total Stockholders’ Equity
This ratio compares a company’s total liabilities to its equity, showing how much debt is used to finance operations relative to shareholders’ investment. A higher ratio indicates greater reliance on debt financing, which increases financial risk but may also provide growth opportunities.
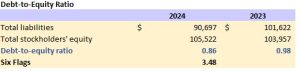
Disney’s ratios reflect a lower reliance on debt financing compared to shareholder investment compared to Six Flags. Disney’s ratio remains much lower at 0.86 in 2024 compared to Six Flags’ ratio of 3.48, which signals that Six Flags has more than three times much debt as equity.
Times-Interest-Earned Ratio
Formula:
Times-Interest-Earned Ratio = (Income Before Interest and Taxes) ÷ Interest Expense
This ratio evaluates how many times a company’s operating income can cover its annual interest obligations. A higher number indicates stronger protection for creditors and a lower risk of default.
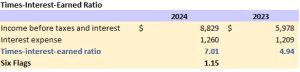
Disney’s improvement in 2024 was due to s higher earnings, which provided a more margin of safety for covering interest charges. Compared to Six Flags’ ratios of 1.15 in 2024, Disney demonstrates a significantly stronger ability to service its debt.
Interpretation
- A higher debt-to-equity ratio means more financial leverage but also more risk.
- A higher times-interest-earned ratio suggests stronger creditworthiness, as earnings can comfortably cover interest costs.
In Disney’s case, 2024 results show both modest leverage relative to shareholder investment and a significant improvement in earnings power, giving creditors considerable confidence in the company’s long-term solvency.
Financial Ratios for Common Stockholders
Investors who hold or are considering buying a company’s stock are particularly interested in ratios that show profitability, liquidity, and solvency from a shareholder’s perspective. Four key ratios include:
- Earnings per share (EPS).
- Price-earnings (P/E) ratio.
- Dividend yield.
Earnings per Share (EPS)
Formula:
Earnings per Share (EPS) = (Net Income – Preferred Dividends) ÷ Weighted-Average Common Shares Outstanding
EPS measures the portion of a company’s profit allocated to each outstanding share of common stock. It is one of the most widely cited indicators of profitability for shareholders.
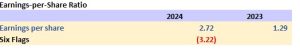
This represents a 111% increase year-over-year, which was in line with the increase in overall net income. Six Flags EPS outpaced Disney’s in 2023 at $2.42, however, fell behind significantly in 2024 with a reported loss per share of <$3.22>.
Price-Earnings Ratio (P/E)
Formula:
Price-Earnings Ratio (P/E) = Market Price per Share ÷ Earnings per Share
The P/E ratio is a key valuation tool for analysts and investors. It shows how much investors are willing to pay for each dollar of earnings.
- A higher P/E ratio indicates that investors expect stronger future growth.
- A lower P/E ratio may suggest undervaluation or weaker growth expectations.
Disney’s P/E in 2023 was much higher at 54.7 times compared to than Six Flags’ at 16.3 times, expressing investors’ ongoing confidence in Disney. In 2024 Disney’s P/E dropped to 35.9 times, or approximately 35%. Disney’s 2024 P/E remained significantly higher than Six Flags given Six Flags’ negative earnings per share in 2024 resulting in an invalid P/E ratio.
Analysts often use this ratio to compare companies within the same industry. If two firms have similar earnings and risk profiles, the one with the lower P/E ratio may present the better investment opportunity. For consistency, the P/E ratio is typically calculated using the latest market price per share and the company’s EPS from the most recent four quarters.
Dividend Yield
Formula:
Dividend Yield = Annual Dividend per Share ÷ Market Price per Share
Dividend yield shows the return on investment from dividends relative to the stock’s market price. Investors focused on income may prioritize a higher yield, while others may place more emphasis on potential stock price appreciation.
For Disney:
- 2023: 0.25-0.30%
- 2024: 0.60-0.70%
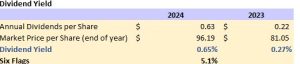
During the same period, Six Flags experienced a dividend yield of approximately 5.1% in 2024. Disney reinvests a higher level of capital into its ongoing business compared to Six Flags.
Key Takeaway
- Dividend Yield highlights the income return from dividends relative to stock price.
Limitations of Financial Statement Analysis
While ratios, percentages, and comparisons are valuable tools for evaluating companies, they come with limitations that must be carefully considered:
- Economic and Industry Conditions
- Ratios must be interpreted in light of broader economic trends and the industry environment in which the company operates.
- Comparability Issues
- Companies in the same industry may use different accounting methods (e.g., FIFO vs. LIFO for inventory). This can distort comparisons of measures like inventory turnover.
- Inflation can also skew results, particularly in horizontal or trend analysis, if adjustments aren’t made.
- Firm Differences
- Companies vary in size, product lines, and operations. Conglomerates, for example, often cannot be neatly compared to smaller, single-industry firms.
Homework 5.3: Better Call Saul LLP vs. Hamlin, Hamlin & McGill (HHM)
Background:
Saul Goodman has decided to benchmark his scrappy law practice (Better Call Saul LLP) against his old rivals at Hamlin, Hamlin & McGill (HHM). To do this, you’ve been hired as the “financial forensic consultant” to compare key ratios for both firms.
The ratios below are simplified but reflect real-world benchmarking: profitability, efficiency, liquidity, solvency, and shareholder return.
Financial Data (Simplified)
(in $000s except per share data)
| Year | Firm | Net Sales | Gross Profit | Net Income | Total Assets | Stockholders’ Equity | Current Assets | Current Liabilities | Inventory | Accounts Receivable | Shares Outstanding | Market Price per Share | Dividends per Share |
|---|---|---|---|---|---|---|---|---|---|---|---|---|---|
| 2023 | Saul LLP | 1,200 | 400 | 30 | 1,500 | 300 | 400 | 500 | 100 | 200 | 100 | $30 | $0.10 |
| 2023 | HHM | 5,000 | 2,500 | 400 | 4,000 | 2,000 | 1,800 | 900 | 300 | 700 | 400 | $40 | $1.50 |
| 2024 | Saul LLP | 1,500 | 600 | 80 | 1,800 | 400 | 420 | 600 | 120 | 250 | 100 | $35 | $0.15 |
| 2024 | HHM | 5,500 | 2,750 | 200 | 4,200 | 2,100 | 1,700 | 1,200 | 350 | 800 | 400 | $35 | $1.75 |
Required Ratios & Analysis
-
Gross Profit Percentage
Formula: Gross Profit ÷ Net Sales-
Compare Saul LLP to HHM for both years.
-
Who is controlling costs better?
-
-
Return on Sales (Profit Margin)
Formula: Net Income ÷ Net Sales-
Which firm is more profitable relative to sales?
-
Did Saul close the gap with HHM in 2024?
-
-
Return on Assets (ROA)
Formula: Net Income ÷ Average Total Assets-
Calculate for both years.
-
Who uses assets more efficiently to generate profits?
-
-
Return on Equity (ROE)
Formula: Net Income ÷ Average Equity-
Compare Saul’s high leverage vs. HHM’s stronger equity base.
-
What risks does Saul face if profits decline?
-
-
Liquidity Ratios
a. Current Ratio = Current Assets ÷ Current Liabilities
b. Quick Ratio = (Cash + A/R) ÷ Current Liabilities-
Which firm is in better short-term financial health?
-
-
Efficiency Ratios
a. Accounts Receivable Turnover = Net Sales ÷ Average A/R
b. Average Collection Period = 365 ÷ A/R Turnover
c. Inventory Turnover = COGS ÷ Average Inventory
d. Days’ Sales in Inventory = 365 ÷ Inventory Turnover-
Who is collecting cash faster? Who is managing inventory better?
-
-
Leverage / Solvency
a. Debt-to-Equity = Total Liabilities ÷ Equity
b. Times Interest Earned = EBIT ÷ Interest Expense (assume Saul LLP’s interest = $20k; HHM’s interest = $30k each year)-
Which firm looks riskier to creditors?
-
-
Stockholder Ratios
a. Earnings per Share (EPS) = Net Income ÷ Shares Outstanding
b. Price-Earnings (P/E) = Market Price ÷ EPS
c. Dividend Yield = Dividend per Share ÷ Market Price-
Compare Saul LLP’s “penny dividends” to HHM’s more generous payouts.
-
If you were a shareholder, which firm looks more attractive in 2024?
-
