10 pClone: Exploring Promoters with Synthetic Biology
Lab Introduction and protocol by Carolina Biotechnology
The timing of gene expression is the mechanism through which an organism’s genetic information controls cellular metabolism and many other critical life processes. Inappropriate gene expression can lead to diseases such as cancer and diabetes. Gene expression involves transcription of DNA into RNA and the translation of RNA to create proteins. Promoters are DNA sequences that initiate transcription and are among the most important and most studied elements controlling gene expression. Information about how promoters function has applications in basic science research and biological engineering. In this lab, you will clone two promoters and indirectly test their ability to initiate transcription of a gene that encodes a red fluorescent protein (RFP). RFP is an example of a “reporter gene”, which researchers use to study gene expression because the characteristics they confer on organisms expressing them are easily identified and measured. You will be supplied two different pairs of complementary strands of single-stranded DNA (ssDNA) molecules. From these ssDNA molecules, you will build double-stranded DNA (dsDNA) promoters that you will clone into a plasmid called pClone Red, using a cloning method called Golden Gate assembly (GGA). After cloning the promoters, you will transform E. coli with GGA reactions containing the promoter mixed with the plasmid and will then plate the transformed bacteria to produce ampicillin-resistant colonies. The plasmid contains a gene that enables bacteria that have the plasmid to survive in the presence of the antibiotic, ampicillin. Once the bacterial colonies express the fluorescent proteins, you will measure the level of these proteins by using the free software program lmageJ.
Bacterial Promoters
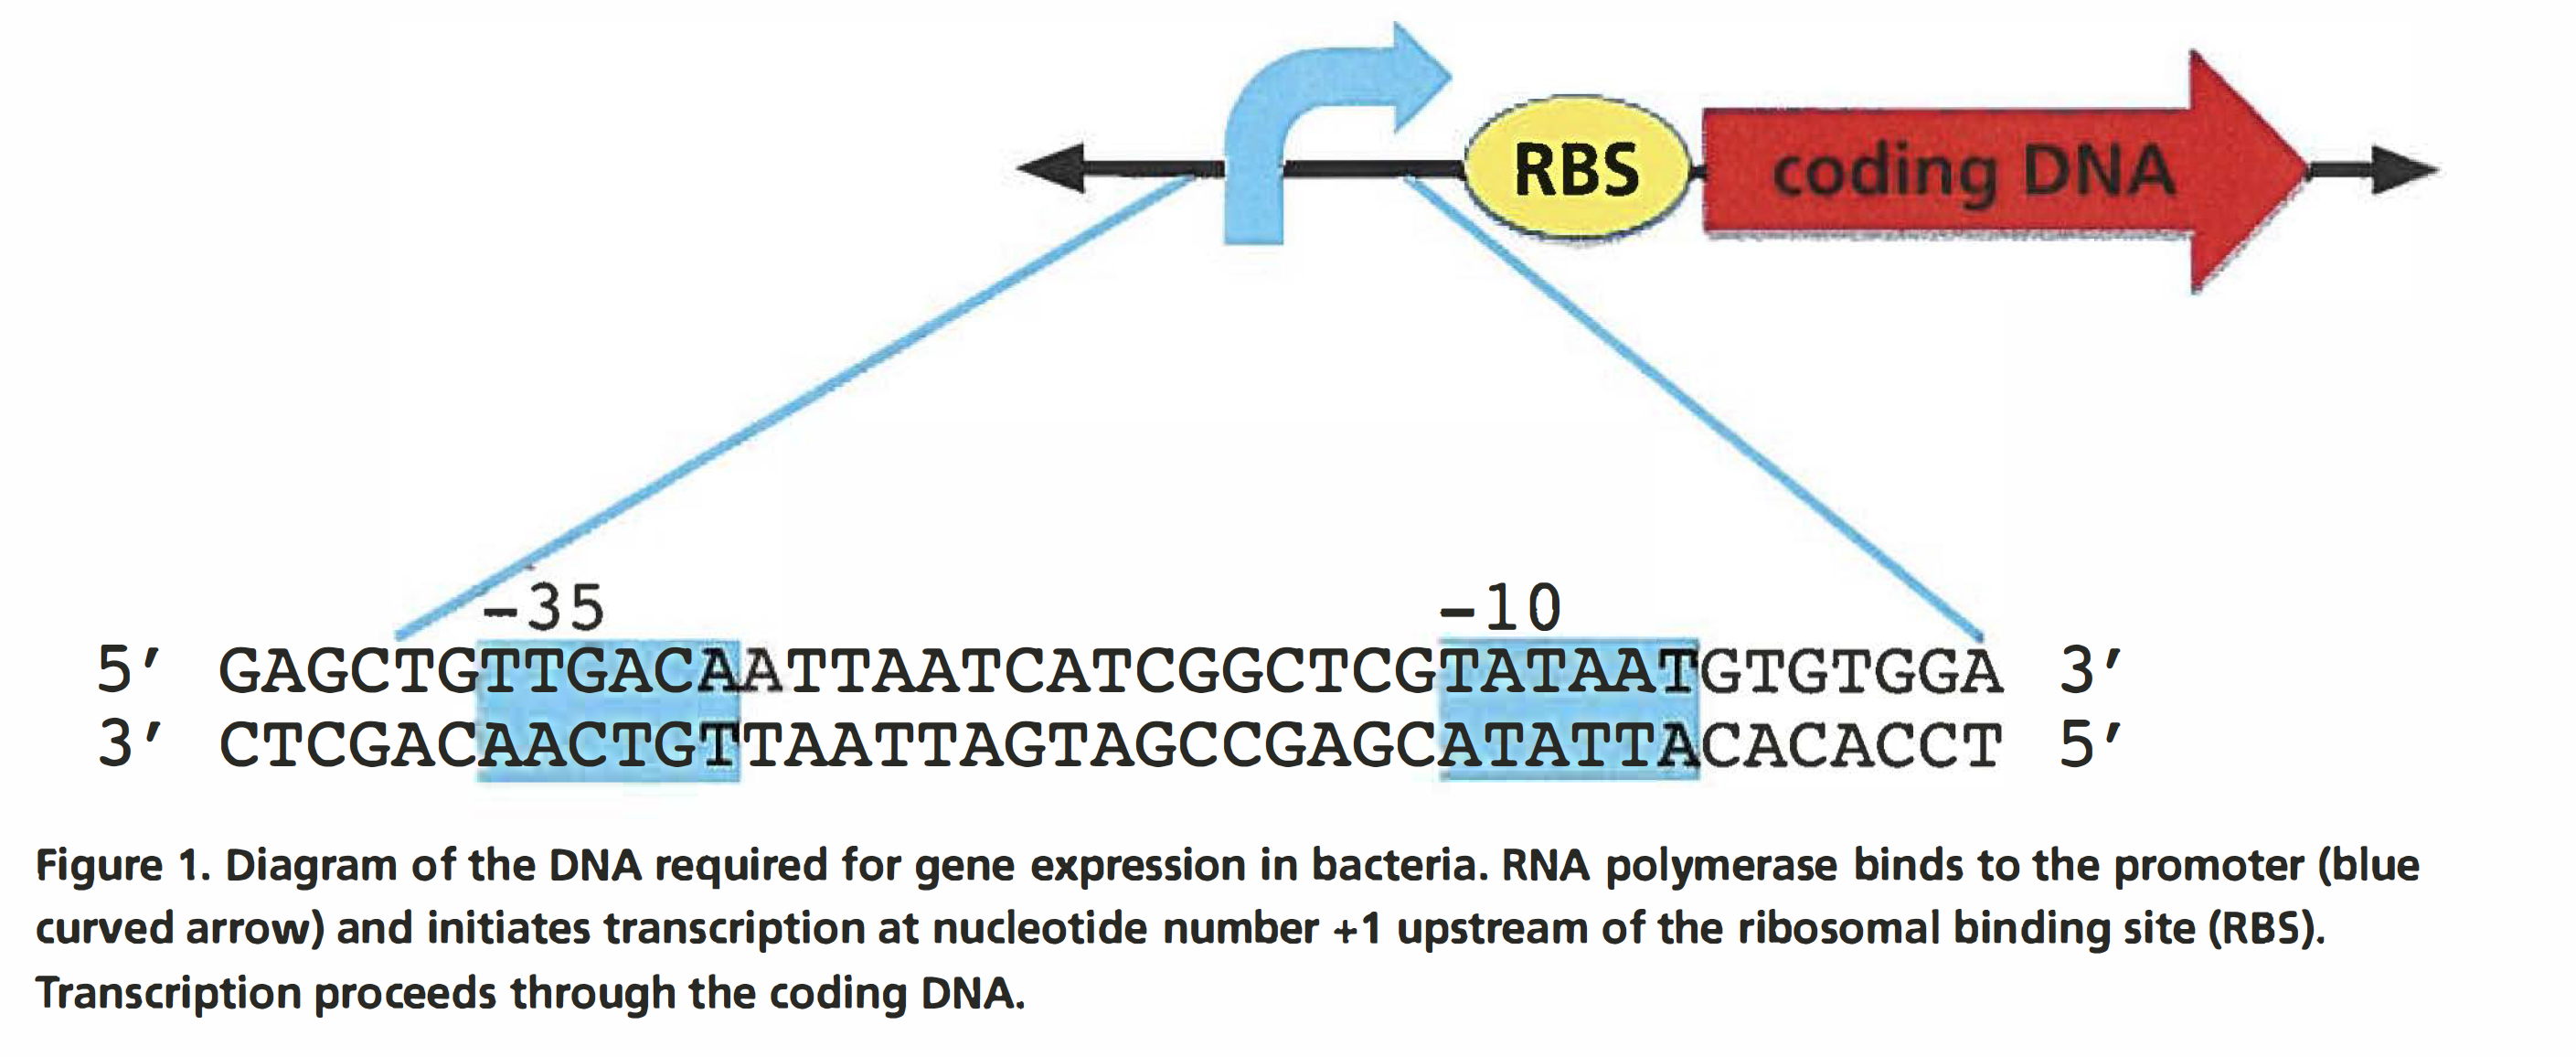
One of the fundamental concepts in biology is the transfer of information from the genome to the cell. This transfer is accomplished through the transcription of DNA to RNA, and the subsequent translation of the RNA into protein. Appropriate regulation of gene expression is critical for the function of all organisms. Transcription plays a key role in controlling what protein is made in what cell and when. The change in the set of proteins in a cell serves many functions. In bacteria, many genes are transcribed only under conditions in which their protein products are needed. In multicellular organisms, each cell contains the same genes, but not all of the genes are expressed, so different cells contain different proteins. Control of gene expression allows the different cells to carry out their different functions in their specific environments. The growth of different tissues during development also requires that different cells express different proteins. The main modulator of gene transcription is called the promoter. This laboratory focuses on the role of the promoter in regulating gene expression. In this lab, you will work with slightly different promoter sequences to measure their effects on the expression of reporter proteins encoded on plasmids. A reporter protein is used as an indicator of transcription from a specific promoter. Reporter proteins have a characteristic, such as color, that makes it easy to measure how much protein is present in the cell. Figure 1 shows the elements required for expression of a gene in bacteria. The numbering of the nucleotides composing the coding region of a gene starts at+ 1, which corresponds to the first nucleotide transcribed by RNA polymerase and the first nucleotide in the mRNA produced by transcription. Nucleotides upstream of+ 1 are numbered consecutively with negative numbers, with -1 immediately adjacent to + 1. Bacterial promoters are always described using negative numbers because they are located upstream of the + 1 nucleotide.
Promoters in eukaryotes, bacteria, and viruses contain two important binding sites for RNA polymerase. The first binding site attracts RNA polymerase to the DNA, while the second one facilitates conversion of the DNA from double stranded to single stranded so that the DNA can be transcribed. In E. coli and other bacteria, a common promoter structure is one in which RNA polymerase binds first to the nucleotides centered approximately on base -35 and then to the nucleotide centered approximately on -10 (Figure 1). Once the RNA polymerase has bound to the promoter, transcription proceeds toward the +1 nucleotide and through the rest of the gene. In bacterial mRNA, shortly after the+ 1 nucleotide is the ribosomal binding site (RBS}, which often begins at around nucleotides +6 to +8. The RBS is where the ribosome binds to the mRNA to initiate translation. In bacteria, translation commences before transcription is completed, meaning that mRNAs that are not fully produced can have ribosomes bound to them that are in the process of translating the encoded protein.
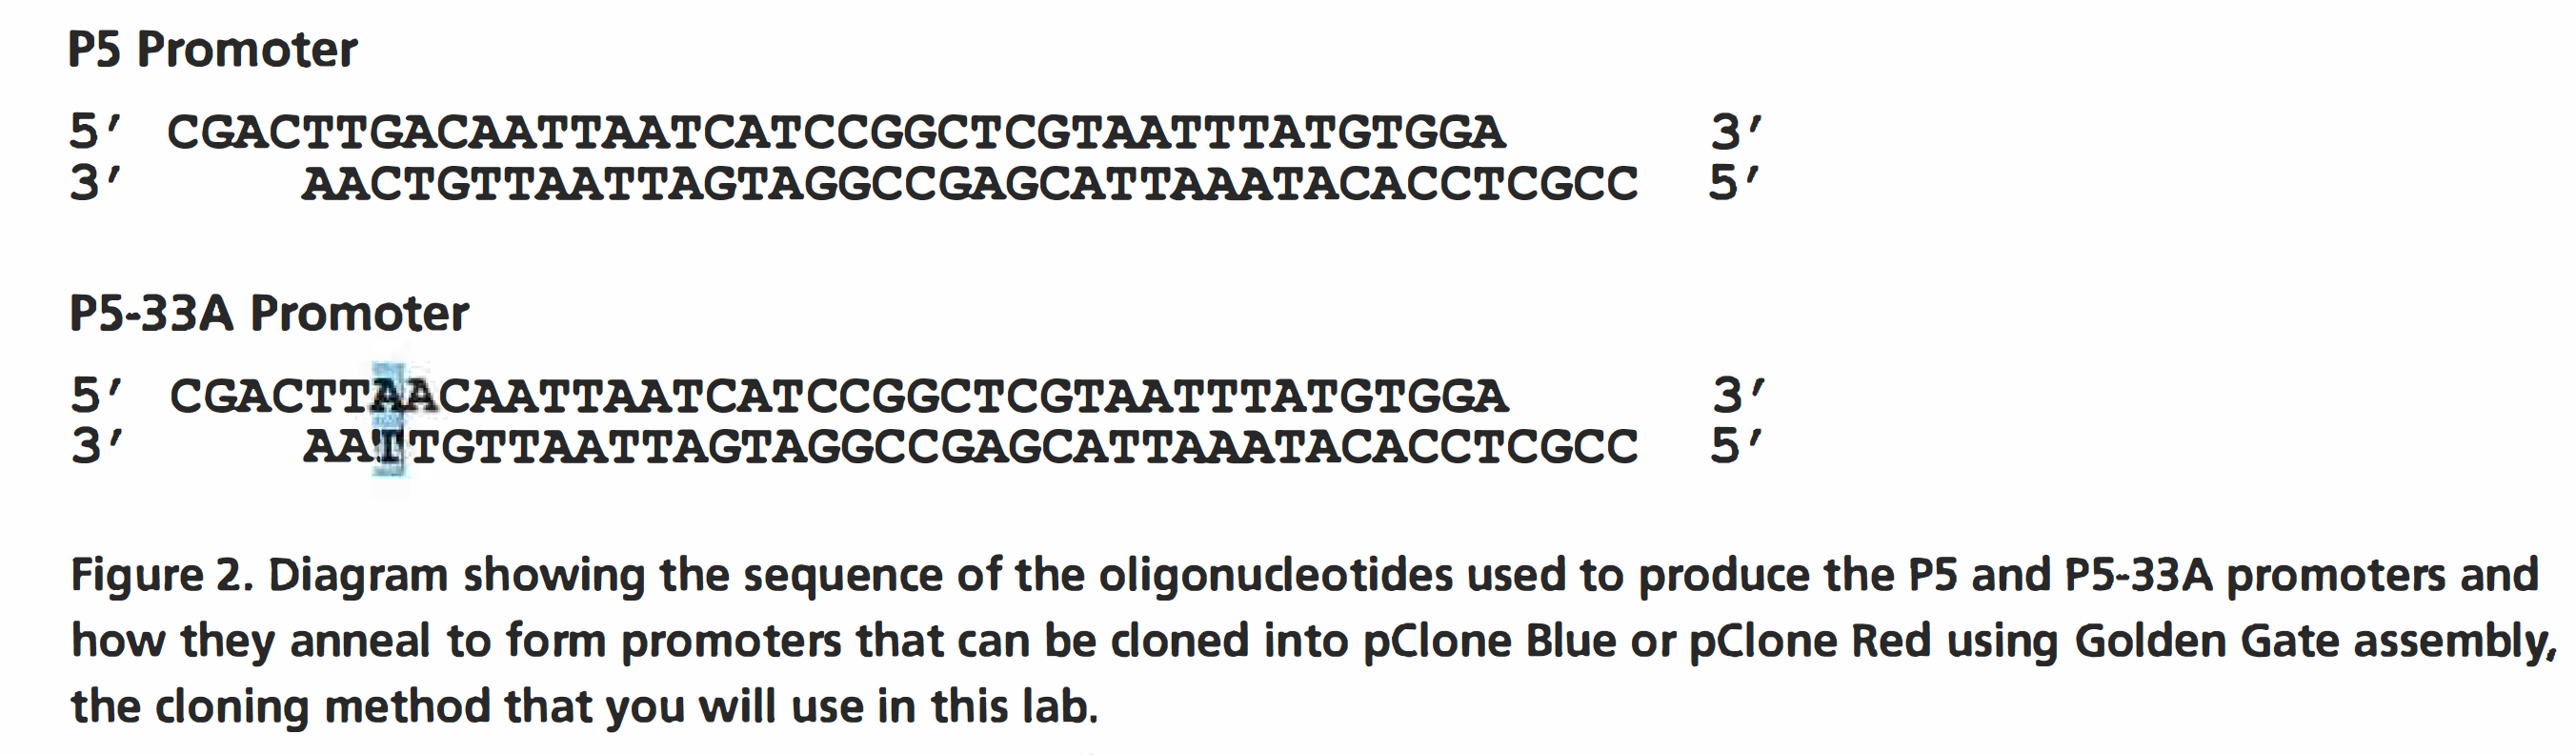
 The consensus sequence represents the order of the nucleotides that most frequently occurs at a given location in a DNA sequence for a given species. For example, the -10 consensus sequence in a E. coli promoter is TATAAT. The consensus sequence for the -35 region is TTGACA. Not every promoter has this sequence; individual promoter sequences usually vary by one or more bases. The degree of variation from the consensus is the major determinant of how well the RNA polymerase will bind to the promoter. The affinity of RNA polymerase determines the baseline transcriptional strength of a promoter. The baseline expression of a promoter can be affected by other factors. Promoters in genomes are longer than the 41 bases shown in Figure 1. The additional bases make it possible to control the timing of expression and the amount of mRNA made. Typically, a bacterial promoter is active unless transcription is prevented by the binding of a protein called a repressor to the promoter sequence. Alternatively, some promoters require that an additional protein called an activator bind to the promoter before transcription can begin. In this kit, you will use a simplified promoter that has a -10 and a -35 element but does not contain any additional regulatory elements. During GGA, you will remove the promoter that drives the transcription of green fluorescent protein (GFP) from the plasmid pClone Red. In its place, you will clone two different promoters, one functional and one hypothesized to be nonfunctional. The functional promoter (P5) has the sequence shown in Figure 2 and is a constitutive promoter, meaning it is always active. The nonfunctional promoter (P5-33A) has a single base variation from the wild-type P5 that reduces the binding of RNA polymerase and we predict will greatly reduce the rate at which the reporter gene is transcribed.
To generate these two promoters, you will be provided with two pairs of single-stranded (ss) short polymers of DNA (also called oligonucleotides) that you will assemble into double-stranded (ds) DNA. Notice that the dsDNA has a short single-stranded segment of four bases on each end that are called “sticky ends” and will be described in more detail later.
Golden Gate Assembly Cloning Method
To avoid many of the common difficulties of cloning, this laboratory uses the Golden Gate assembly (GGA) cloning method adapted for use with the pClone Red plasmid (Weber, 2011; Werner, 2012).
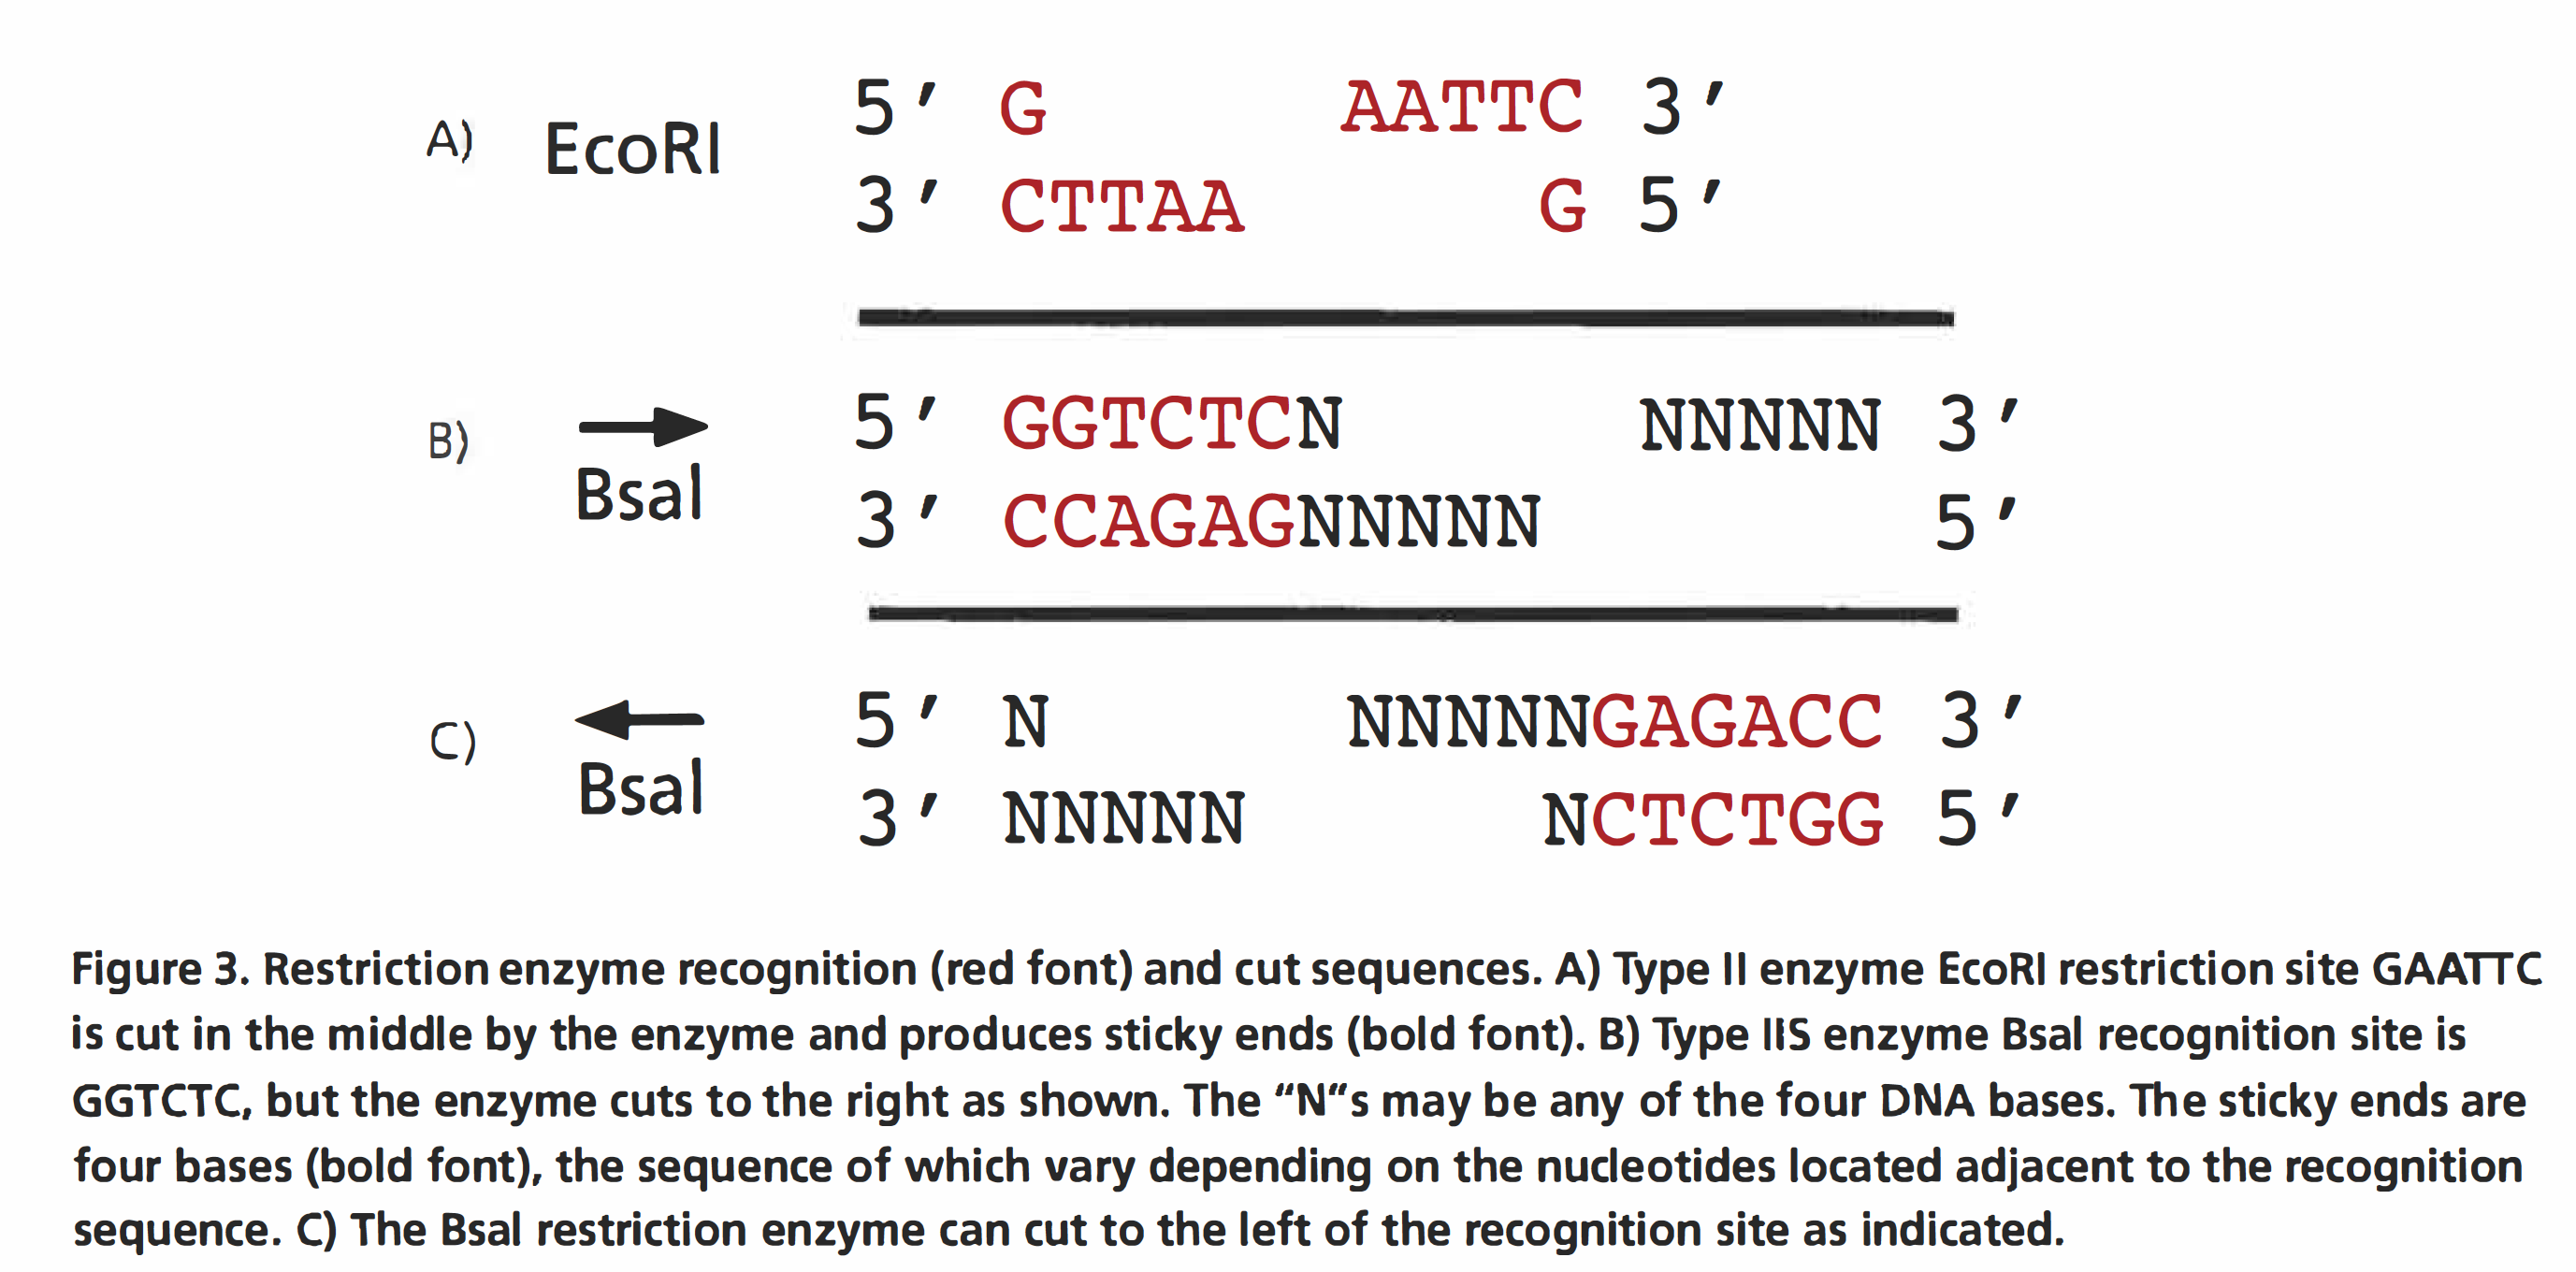
The GGA protocol relies on the type 11S restriction enzyme Bsal (Figure 3). The use of this enzyme allows you to cut the plasmid DNA and ligate the desired insert in the same reaction. Unlike many of the commonly used type II restriction enzymes that cut within their recognition sequences (e.g., EcoRI, see Figure 3A}, Bsal cuts outside its recognition sequence. Regardless of whether the 5′ GGTCTC 3′ recognition site is on the top or bottom strand, the Bsal cuts 3′ to the sequence. To keep a clear idea of this in mind, it is useful to label each Bsal site with an arrow indicating whether the cut is to the left or to the right of the binding site. The Bsal staggered cut produces a 5′ overhang four bases long whose sequence is independent of the enzyme’s recognition sequence (Figure 3). Because the sequence of this overhanging sequence is independent of the enzyme’s recognition site, the DNA fragments to be connected by GGA can be engineered to any desired sequence. Thus, the fragments can be engineered to have overhanging ends that are complementary, which allows them to ligate, and to have no Bsal recognition sites present in the final ligation product. The importance of the lack of Bsal recognition sites will become clear as the GGA reaction is described further. pClone Red contains two outward-facing Bsal sites flanking the promoter region, so that when the plasmid is cut with the Bsal enzyme, the DNA between the two Bsal cut sites, along with the Bsal recognition sites, is excised to make room for the new promoter (Figure 4).

Figure 4. Diagram of the pClone Red plasmid. Sticky ends are shown inside the white boxes. These sticky ends are generated when the plasmid is cut with BsaI. The black arrows represent the recognition sites for BsaI. pClone Red contains a left-facing GFP gene that includes a functional promoter that initiates transcription to the left. GFP is produced unless a NEW promoter is cloned in to initiate transcription of RFP.
To carry out the GGA reaction, the new promoter insert and the plasmid (pClone Red) are mixed with Bsal and DNA ligase simultaneously in a single tube under conditions that allow both enzymes to function. The reaction is placed into a thermal cycler and the temperature is cycled between 37°C (the optimum temperature for digestion by Bsal) and 16°C (the optimum temperature for ligation). During digestion, the original promoter is cut out of the plasmid, leaving overhanging base pairs (sticky ends) that are complementary to the overhanging base pairs of the new promoter insert (see Figure 3). When the temperature is shifted to 16°C, ligation occurs. During ligation, the new promoter with its complementary overhanging nucleotides is ligated into the plasmid. The original promoter may also religate into the plasmid, but because reinsertion of this original DNA fragment regenerates the Bsal sites, the recently religated original promoter will be cut out again during the next digestion step. Plasmid with the new promoter ligated into it cannot be digested, because the Bsal recognition sites are no longer present. The GGA reaction is put through multiple cycles, reducing the number of plasmid molecules containing the original promoter and increasing the number of plasmid molecules with the new promoter. The GGA reaction terminates with a 5-minute incubation at 37 °C to cleave as many as possible of the remaining Bsal sites in plasmid still containing the original promoter.
The pClone plasmids have been engineered specifically for GGA. As mentioned above, each plasmid contains two opposing Bsal sites so that the DNA between the two Bsal sites can be excised by Bsal digestion to make room for the new promoter (Figure 4). In addition, these plasmids allow you to distinguish between colonies containing the following:
• plasmid with the old promoter (they are green).
• plasmid with a new functional promoter (they are red)
• plasmids without a functional promoter (they are yellowish white).
In its original form, pClone Red produces GFP: the GFP gene faces “backward,” meaning that the promoter is not shown in the conventional right-facing direction. Because a gene can be encoded by either strand of dsDNA, backward applies only to the way we look at genes on paper. The left-facing functional promoter driving GFP expression is flanked by two Bsal sites, so the original promoter is removed during GGA. The introduction of the new P5 or P5-33A promoter changes the direction of transcription. Thus, pClone Red no longer expresses GFP but instead expresses RFP (red fluorescent protein). RFP fluoresces when stimulated by UV light, but the red pigment is visible under white light as well. The original RFP gene was isolated from a species of mushroom coral from the genus Discosoma. Green fluorescent protein (GFP) was isolated from the jellyfish Aequorea victoria. GFP can sometimes be seen under white light but is more easily seen under UV light. For quantifying the expression of RFP using lmageJ, the plates must be photographed on a UV transilluminator. The GFP expressed from the default promoter is also visible under white light. However, in order to distinguish between the green colonies containing the original promoter and the yellowish white colonies without a functional promoter, it is best to take photos of the plates while they are on a UV transilluminator.
Quantifying Promoter Expression
The goal of this lab is for you to explore and discover the critical role of promoters in regulating transcription. Promoter strength can be defined as the rate at which RNA polymerase produces mRNA.
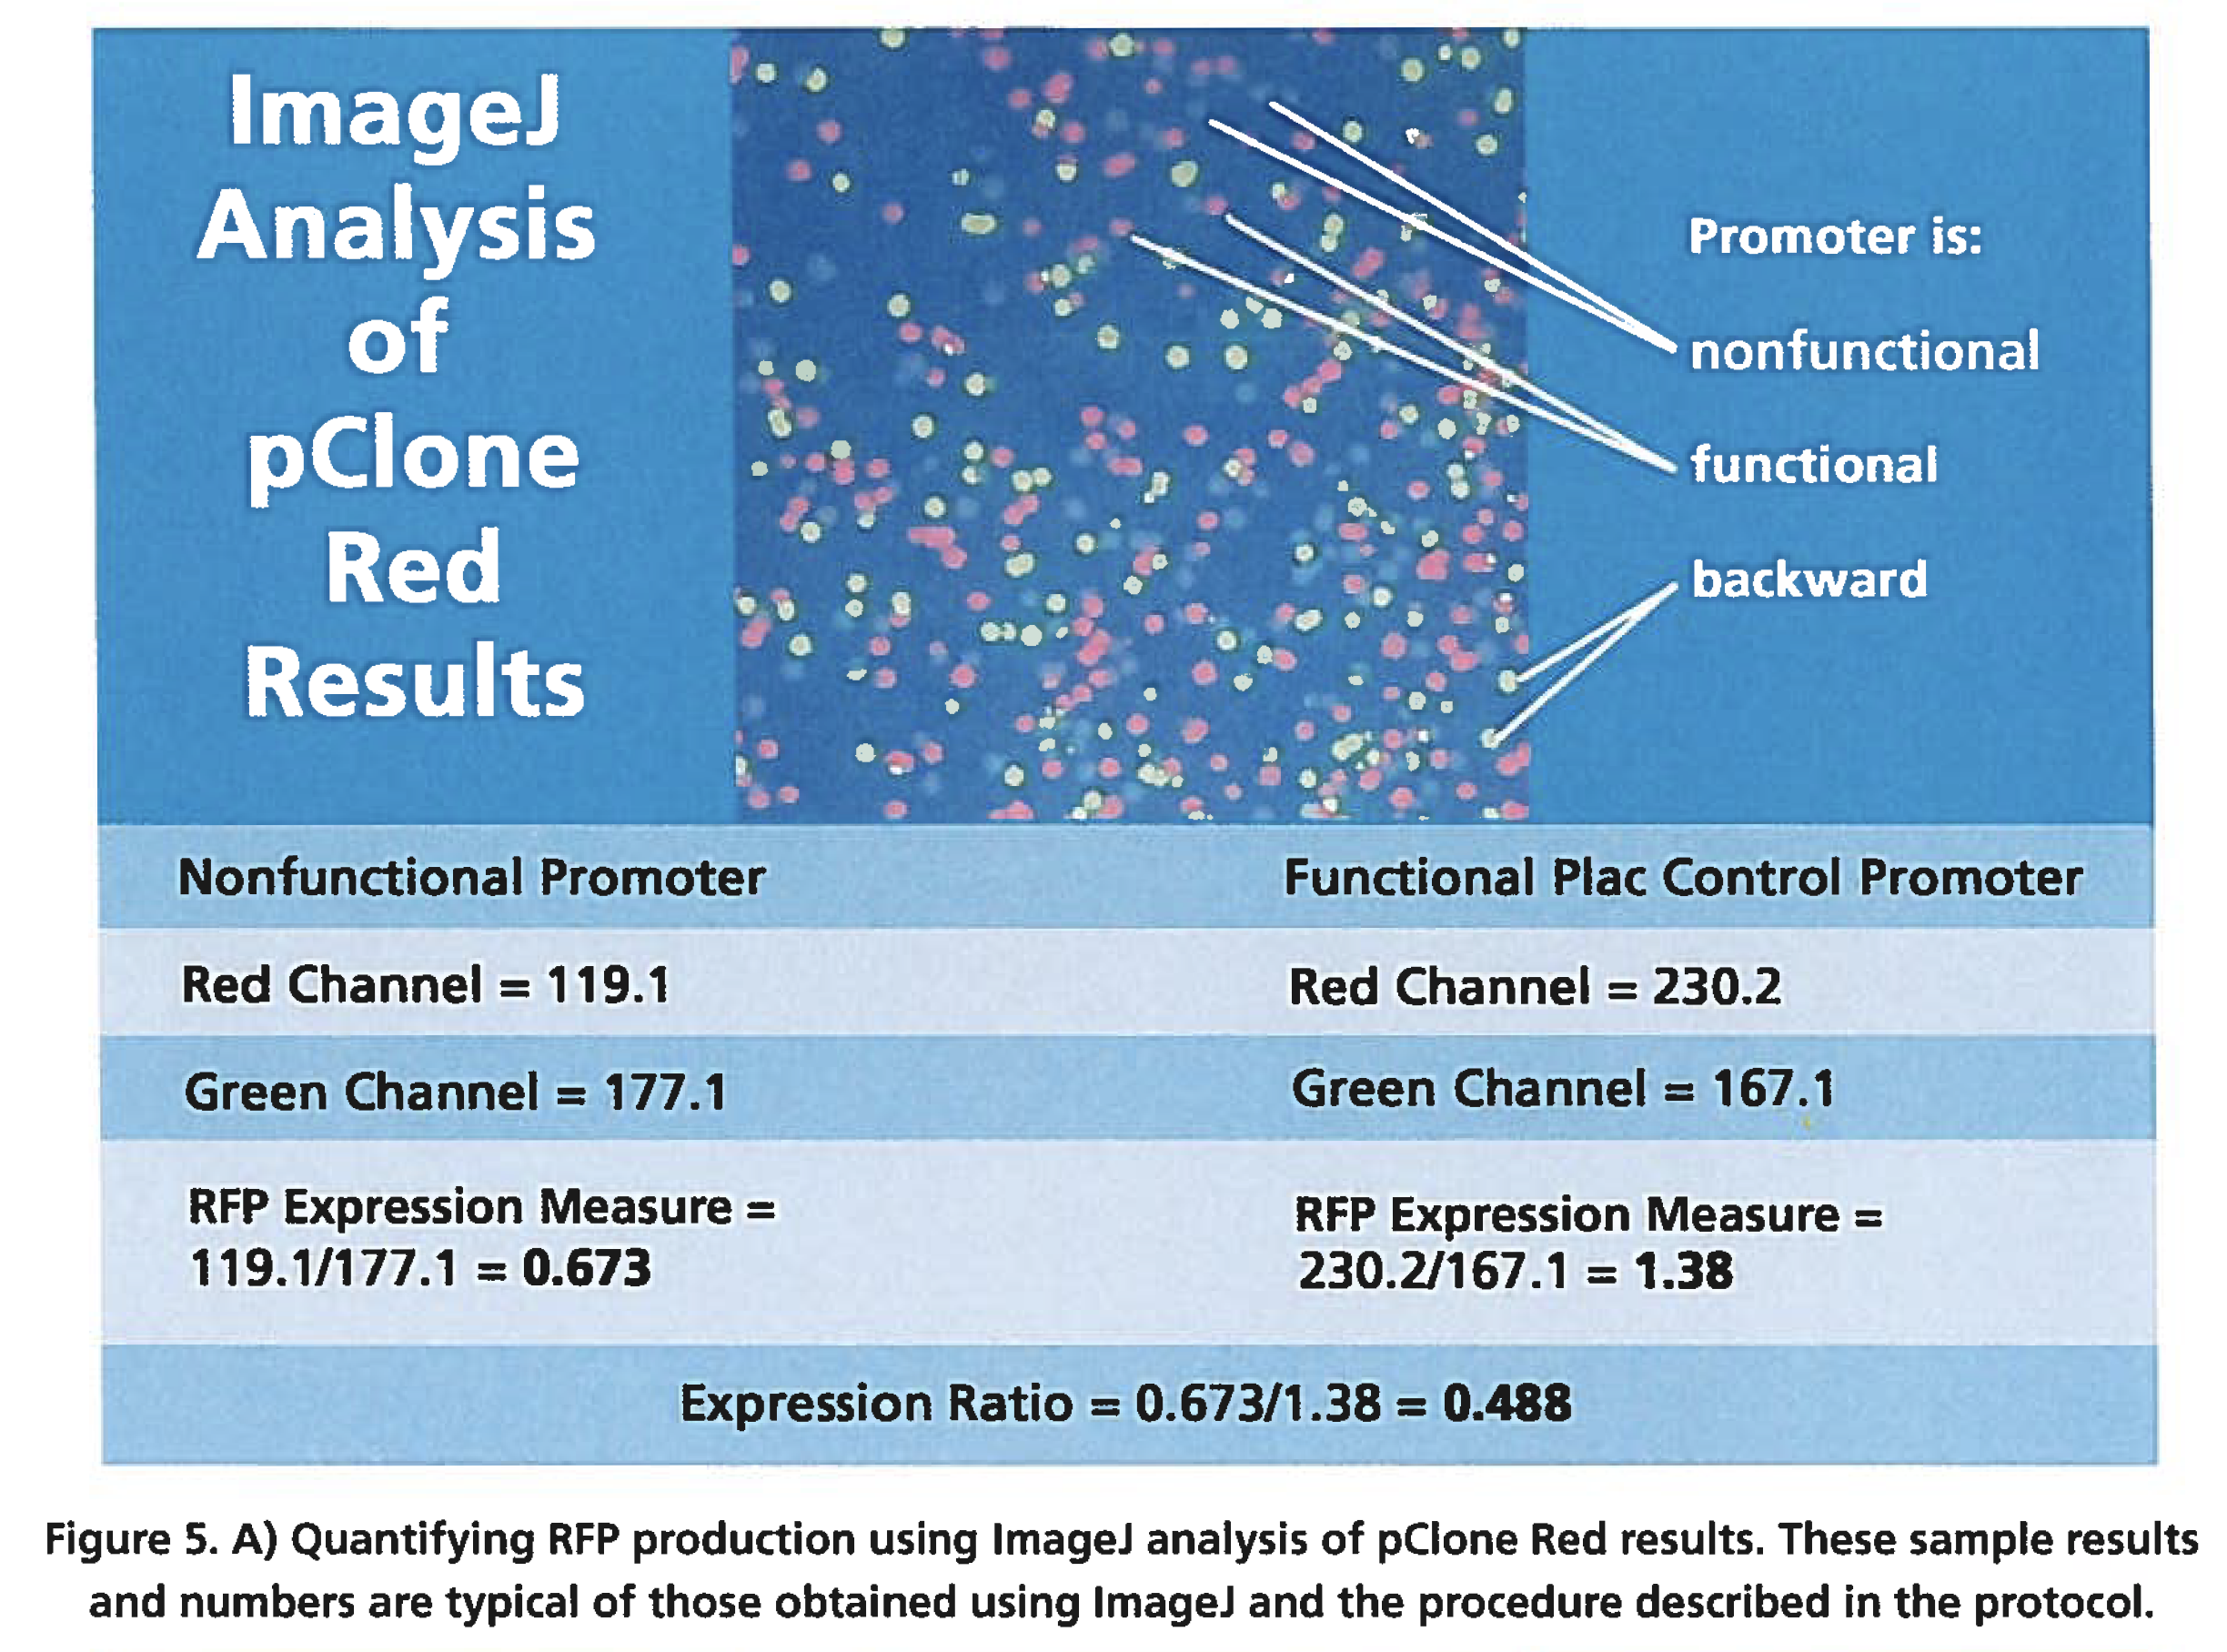
To measure promoter strength directly, you would measure mRNA production, but that is technically challenging. A good alternative is to measure mRNA production indirectly, by quantifying the amount of protein produced by translation of the mRNA. In general, the amount of protein produced is proportional to the quantity of mRNA present. One way to quantify the amount of protein produced by the gene and thus, the strength of the promoter, is to take a digital photograph of colonies and then use the free software program lmageJ to make measurements (Figure 5). To quantify with lmageJ, begin by opening an image file of a colony that was photographed as you were instructed. Use lmageJ to draw circles within the colonies or spots to be analyzed (you may have to zoom
in first). The image is split into red, green, and blue channels, and a measurement is made by lmageJ of the intensity of color for each channel. Measurement of RFP output is obtained by dividing the red channel intensity by the green channel intensity. The measurements obtained in the red channel are divided by the measurements obtained in the green channel to correct for any difference in the red channel measurements that result from the methodology used rather than from an actual difference in the amount of protein being expressed. For example, if a larger circle is drawn within colony A than within colony B, it may appear that the promoter in colony A is expressing more RFP than the one in colony B, when in fact, the difference is simply a result of the size of the circle drawn. The lmageJ method of dividing red channel measurements by green channel measurements has been validated by comparison to measurements using fluorometry.