5 Mitochondrial DNA Intro
B344: Mitochondrial DNA Experiment
Goals:
- Use your DNA to place yourself in the humans of the world mtDNA phylogenetic tree
- Find the geographic origin of your maternal lineage by analyzing a portion of your mtDNA.
Task: Extraction, Sequencing and Analysis of mtDNA
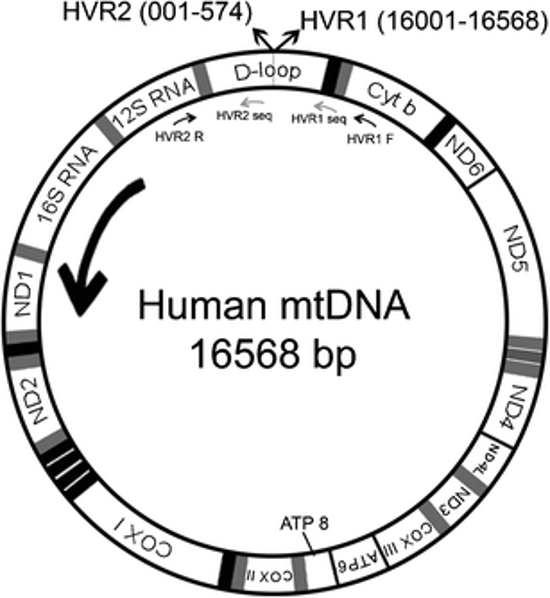
Human cells have three billion base pairs (bp) of chromosomal DNA, but they also have a much smaller amount of mitochondrial DNA (mtDNA). Human mitochondrial DNA is a ring consisting of only 16,569 bp. This ring contains a tiny number of genes—37, as compared with about 20,000 in the haploid human genome. Thirteen of these genes code for proteins involved in aerobic respiration. The majority of the genes code for rRNAs and tRNAs. You may remember that mitochondria have their own ribosomes; these rRNAs and tRNAs are used for protein synthesis within the mitochondrion. A small segment of the mtDNA has no genes and is called the control region (D-loop) because it controls the replication and protein synthesis of the rest of the mtDNA. A diagram of mtDNA appears below. We will use the primers shown below (HVR2 R and HVR1 F) to amplify a section of your mtDNA. We’ll then use another primer (HVR1 seq ) to sequence a portion of your amplicon.

This mitochondrial DNA (mtDNA) may be small, but it is important for three reasons:
- First, some parts of mtDNA mutate at about 10 times the rate of chromosomal DNA, undergoing a net change of 2.5% per million years. This means that in a mere 10,000 years, we could expect 4 persisting nucleotide changes. This fast mutation rate means that mitochondrial DNA has been used to examine the differences that have developed between human ethnic groups in the 150,000-200,000 years that modern humans have existed. It is thought that this high mutation rate results from the mtDNA’s exposure to free radicals generated during respiration.
- Second, mitochondrial DNA is inherited only from the mother. Only a few sperm mitochondria enter the zygote, and it seems they are mostly destroyed. By contrast, the egg contains 100,000 mitochondria. Therefore, if you don’t like your mitochondrial DNA, you are entirely justified in laying all the blame on your mother!
- Third, while there are only two copies of any segment of chromosomal DNA per cell, there are many mitochondria per cell, so there may be hundreds or thousands of copies of the short mtDNA sequence in each cell. This large number of copies makes mtDNA relatively easy to isolate and study.
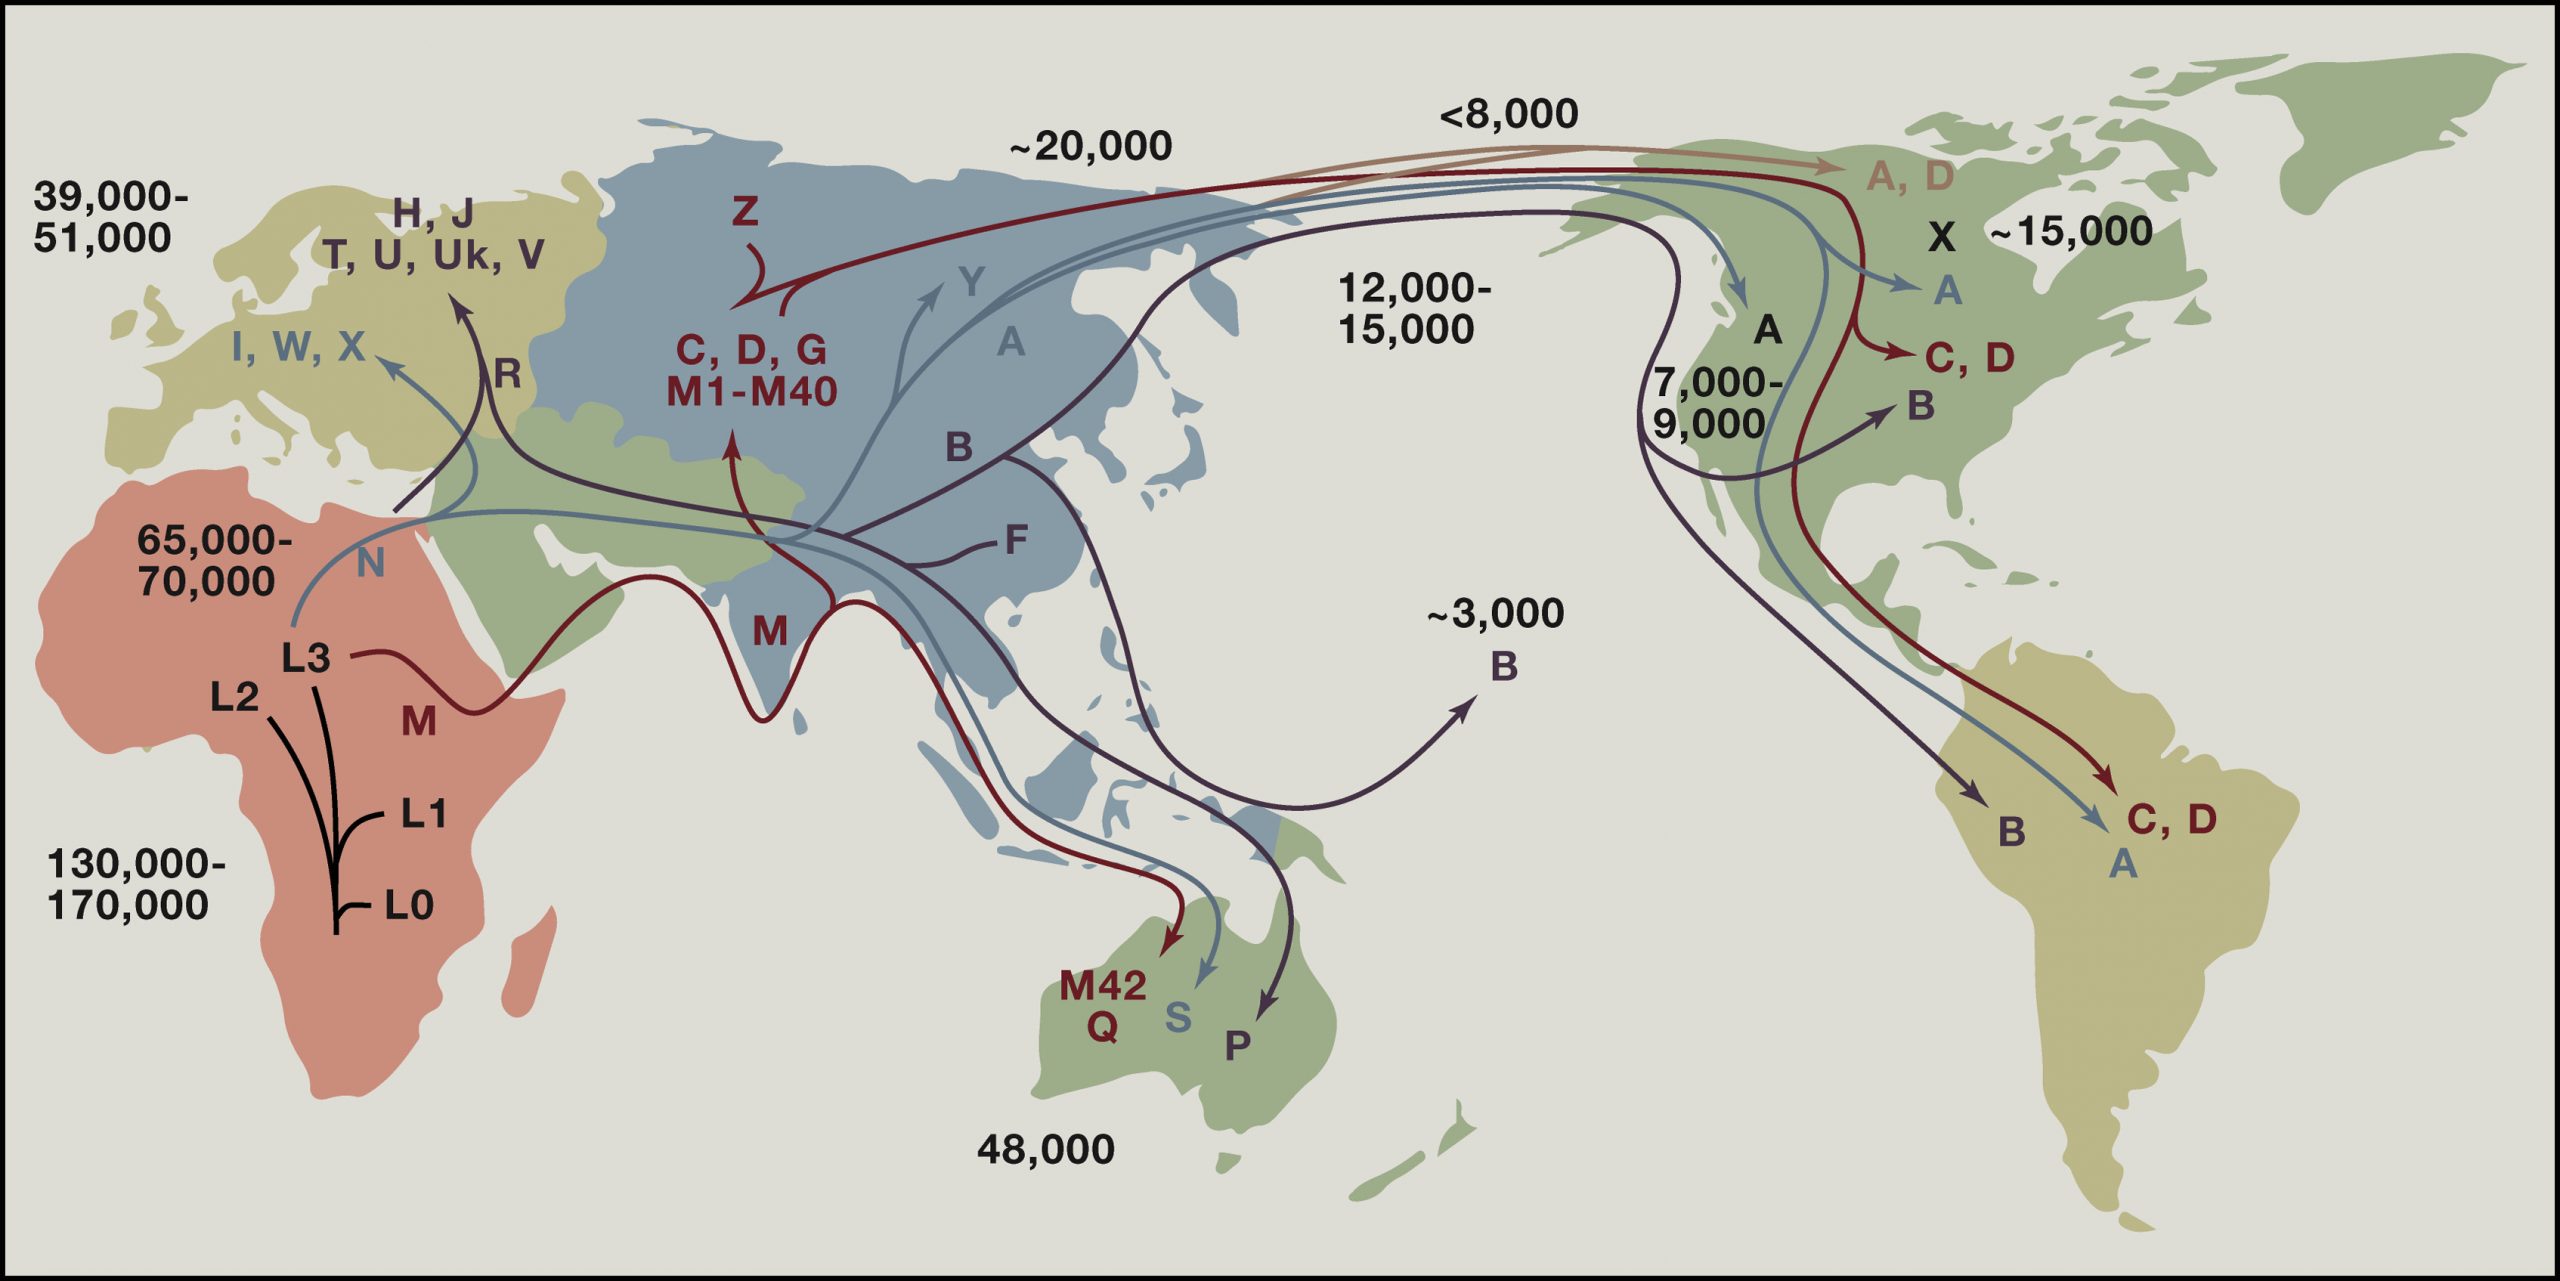
Studies on mtDNA have been used to trace the migration routes of early women from Africa. The letters on the map below show major mitochondrial haplogroups, which are groups defined by specific combinations of mitochondrial DNA sequences. Haplogroups are used to represent the major branch points on the mitochondrial phylogenetic tree. They were named in alphabetical order based on their order of discovery. There are now over 5400 haplogroups that have been defined. The mtDNA tree is rooted in Africa about 130,000 and 170,000 years before present (YBP). For the first ∼100,000 years, mtDNAs radiated within Africa, generating a plethora of African-specific mtDNA haplogroups (L0, 1, 2, 3, etc.) that, in aggregate, are referred to as macrohaplogroup L. Between 45,000 and 65,000 YBP, two mtDNAs, M and N, emerged from within L3 in northeast Africa and successfully left Africa, founding macrohaplogroups M and N, which colonized the rest of the world. Macrohaplogroup N gave rise to multiple European, Asian, and Native American mtDNA lineages, while macrohaplogroup M gave rise to only Asian and Native American haplogroups.

MITOMAP figure and info from Douglas Wallace. Cell. Volume 163, Issue 1, 24 September 2015, Pages 33-38.
We are now starting a multi-lab project that uses your mtDNA to learn about your ancestry:
In your lab notebook, you will write your own complete protocol. Here are the basic steps that you will follow:
Protocol:
- DNA isolation of your cheek-cell DNA (you already did this!). In your lab notebook, you should reference when and where this DNA came from.
- You will perform PCR using primers that amplify the HVR1 and HVR2 regions shown in the mtDNA map above (provided as a mixture of both the F and R primers, both at 10 uM).
F primer: AGGCGTCCTTGCCCTATTACTATC
R primer: CGTGCTTGATGCTTGTTCCTTTTG
- In your lab notebook, calculate the amount of each reagent that you will put into a single PCR reaction. We want to make sure you have enough DNA for sequencing, so we will use 2 uL of DNA in a 50 uL PCR reaction (twice as large as last time). In lab, you will compare with your partner and calculate your master mix volumes.
- We use the primer sequences and amplicon size to determine the PCR cycling conditions.
- My previous attempt found that 34 cycles of PCR produces strong amplification.
- PCR cycling conditions:
- 95 ºC for 2 min
- 34 cycles of: 95 ºC for 30 sec, 53 ºC for 30 sec, 72ºC for 2 min
- Final extension: 72ºC for 5 min
- Analyze the products of your PCR via gel electrophoresis. Run 3 uL of each PCR reaction on a 1% agarose gel that contains GelRed Stain.
- If you see a band of the correct size amplified, you are ready to cleanup your PCR reaction for sequencing.
- Use the rest of your PCR product to perform the Omega E.Z.N.A.® Cycle Pure Kit DNA Cleanup Kit (see your paper protocol packet) to get rid of the PCR reagents that would inhibit the sequencing reaction. You will clean-up the remaining volume of your PCR reaction, and elute your DNA in 30 uL WATER.
- After you elute your DNA, we will quantify the concentration of DNA by using a Nanodrop (a spectrophotometer for small sample volumes)
- Follow the “DNA sequence submission” protocol in your protocol packet to prepare your sample for sequencing. We’ll use the concentration of your DNA to determine the uL of DNA you’ll add to your sequencing reaction.
Here is the sequence of the mtDNA sequencing primer we’ll use. In the mtDNA diagram above, it is called HVR1 Seq:
5′ CCA TTA GCA CCC AAA GCT AAG ATT 3′
Experiment adapted from: Kosinski, R. J., D. R. Weinbrenner, and M. G. Cross. 2008. Extraction, sequencing, and analysis of mitochondrial DNA. Pages 137-166, in Tested Studies for Laboratory Teaching, Volume 29. Proceedings of the 29th Workshop/Conference of the Association for Biology Laboratory Education (ABLE).
