
Module 1: Case Studies & Examples
In this section, we will review some examples of how to generate an initial estimate using two very basic methods. Then, we are going to walk through some case studies so that you can put what you’ve learned into the context of a cyber risk scenario.
The Value of the Initial Analysis
In any organization, decision-making is a crucial process that can significantly impact the success or failure of the organization. Making informed decisions requires access to accurate and relevant information. It does not, however, require in-depth, time-consuming, and expensive research and analysis. The initial analysis provides a quick, cost-effective analysis of risk. It allows decision-makers to have a timely analysis based on readily available data. If decision-makers determine that a more in-depth analysis is warranted, this gives them the opportunity to clearly scope the effort and provide their authorization for the expenditure of additional funds and resources.
What is an Initial Analysis?
An initial analysis is a preliminary assessment of a situation or problem. It involves gathering and analyzing information to understand the situation comprehensively. An initial analysis is typically conducted before making any significant decisions or taking any action. Its purpose is to provide decision-makers with the information they need to make informed decisions. In the case of quantifying risk, you are making estimates with fairly broad ranges (such as 20% or more). This provides an accurate, if broad, estimate. With more detail, the estimate becomes more precise.
Benefits of an Initial Analysis for Decision Support
An initial analysis is valuable for decision support because it gives decision-makers a comprehensive overview of the situation. It allows decision-makers to make informed decisions based on accurate and relevant information. There are several benefits of conducting an initial analysis.
Benefits of Conducting an Initial Analysis
- Provides a Comprehensive Overview: An initial analysis gives decision-makers a comprehensive overview of the situation. It helps decision-makers to understand the situation, including the challenges, risks, and opportunities. This comprehensive overview allows decision-makers to make informed decisions based on accurate and relevant information.
- Identifies Risks and Opportunities: An initial analysis helps to identify risks and opportunities associated with the situation. It allows decision-makers to assess the potential impact of these risks and opportunities on the organization. This information is critical to making informed decisions considering potential risks and opportunities.
- Helps to Identify and Prioritize Options: An initial analysis helps to identify and prioritize options for addressing the situation. It provides decision-makers with a range of options and the potential benefits and risks associated with each option. This information is critical to making informed decisions that consider all available options.
- Facilitates Consensus-Building: An initial analysis helps to facilitate consensus-building among decision-makers. It provides decision-makers with a shared understanding of the situation, which can help to build consensus around the best course of action. This consensus-building is critical to ensuring that decisions are made with the support of all decision-makers.
- Reduces the Risk of Making Poor Decisions: An initial analysis helps to reduce the risk of making poor decisions. It provides decision-makers with accurate and relevant information, which can help to reduce the risk of making decisions based on incomplete or inaccurate information. This can help avoid costly mistakes and ensure that decisions are made in the organization’s best interests.
- Approval for Additional Time and Resources: An initial analysis is typically conducted before making any significant decisions or taking any action. Its purpose is to provide decision-makers with the information they need to make informed decisions. However, in some cases, decision-makers may require additional information before deciding. In these cases, an initial analysis can serve as a basis for approving additional time and resources to produce a more in-depth analysis. This additional analysis can provide decision-makers with more detailed information, which can help to make more informed decisions. By using the initial analysis as a basis for approving additional time and resources, decision-makers can ensure that the additional analysis is focused on the most critical issues and provides the information they need to make informed decisions.
Figure 6 NOTE: Always begin with an initial analysis
General Guidelines for Developing Estimates
- Consider the extent of the threat exposure.
- If you know what percentage of systems have a particular vulnerability, you can use this as the basis for a threat estimate.
- Consider where the asset in question is located in the organization.
- Internet-facing assets generally represent a very high likelihood of compromise if there is an exploitable vulnerability. Any asset with a directly accessible interface to the internet could be considered to meet this criterion if it has an exploitable vulnerability.
- Vulnerabilities in perimeter defenses generally represent a very high likelihood of compromise.
- Vulnerabilities in high-value assets generally are often more important to the organization but this is not necessarily related to the likelihood of compromise..
- Vulnerabilities on web-based servers and applications represent a very high likelihood of compromise. Vulnerabilities on workstations generally represent a high likelihood of compromise.
- Vulnerabilities in databases represent a high likelihood of compromise.
- Vulnerabilities on unsupported systems or products may be considered a higher likelihood of compromise.
- Zero-day vulnerabilities generally represent a very high likelihood of compromise.
- Consider the ease with which the vulnerability could be exploited.
- Perimeter defense Zero-Day vulnerabilities generally represent a very high likelihood of compromise.
- Web servers with Zero-Day vulnerabilities generally represent a very high likelihood of compromise.
- Web server and application exploits such as SQL and Cross-site scripting vulnerabilities generally represent a very high likelihood of compromise.
- Unsupported operating systems and applications generally represent a very high likelihood of compromise as these are frequently targets of attack.
- Consider where in the attack cycle the vulnerability could be used. Initial access and privilege escalation could be considered higher likelihood of compromise because they are at the initial stages of the cyber-attack.
- Remote code execution vulnerabilities generally represent a higher likelihood of compromise.
- Named exploits such as man-in-the-middle type attacks generally represent a higher likelihood of compromise.
- Vulnerabilities for which there may be known or ongoing exploits generally represent a higher likelihood of compromise.
- Vulnerabilities with a public proof-of-concept generally represent a higher likelihood of compromise`. Any vulnerability that can lead to initial access or privilege escalation generally represents a higher likelihood of compromise.
- Internal exploitable vulnerabilities generally represent an elevated likelihood of compromise.
- Consider mitigating factors.
- Strong perimeter defense can be a mitigating factor.
- Security by obscurity is not considered a mitigating factor.
- Policies or procedures may be considered a mitigating factor.
- Mitigating factors generally can reduce an estimate by a single 20% range. A very strong mitigation generally can reduce an estimate by two 20% ranges.
- When estimating the likelihood of a threat actor leveraging the threat against you, it is useful to categorize the threat actor.
- Financially motivated cybercriminals are generally very successful. To refine the scope of your estimate, you may want to specify the targeted system or data.
- Insider threats are generally very successful.
- APTs or nation-states are generally very successful. You may want to specify a particular APT or nation-state to refine your estimate.
- Additional considerations.
- An accidental misconfiguration is as dangerous as an intentional act.
- Poor processes and procedures can represent a risk, especially if they may be undocumented and not consistently applied.
- It is useful to stipulate the time period for your estimate and whether it is a factor in the likelihood of compromise. In some cases, this may be the time period until a patch or remediation is in place. In some cases, the longer the time period, the higher the likelihood of compromise. Similarly, in some cases, a shorter period of exposure may indicate a slightly lower likelihood of compromise.
Using a 1-5 Scale
Risk is an inherent part of any business or organizational activity. It is the possibility of an event occurring that could adversely impact the organization’s objectives. Risk can be expressed in various ways, including verbally, numerically, or graphically. One commonly used method of verbally expressing risk is through a 1-5 scale using the labels very low, low, moderate, high, and very high values.
The Five-Point Scale
The five-point scale is a simple and effective way to express risk verbally. It uses five categories to describe the level of risk associated with an event or activity. The categories are very low, low, moderate, high, and very high. Each category represents a different level of risk, with very low representing the lowest level of risk and very high representing the highest level of risk.
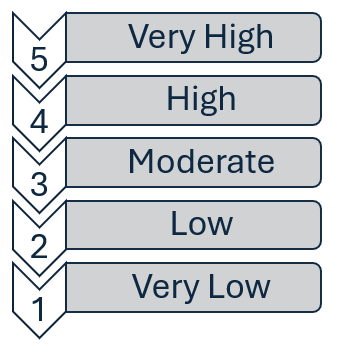
Figure 7 The 5-Point Scale Labels
This scale is beneficial because it allows for quick and easy understanding and consensus-building among different organizational groups. It is a simple and intuitive way to express risk that people with different levels of expertise in risk management can easily understand.
Converting the Scale to 20% Ranges
While the five-point scale is a useful way to express risk qualitatively, it can also be adapted into numerical form, represented by 20% ranges, to quantify the risk. This allows for a more precise and objective assessment of risk that can be used to make informed decisions about risk management.
To convert the five-point scale to 20% ranges, each category is assigned a range of probabilities. The ranges are as follows:
- Very Low: 0% – 20%
- Low: 21% – 40%
- Moderate: 41% – 60%
- High: 61% – 80%
- Very High: 81% – 100%
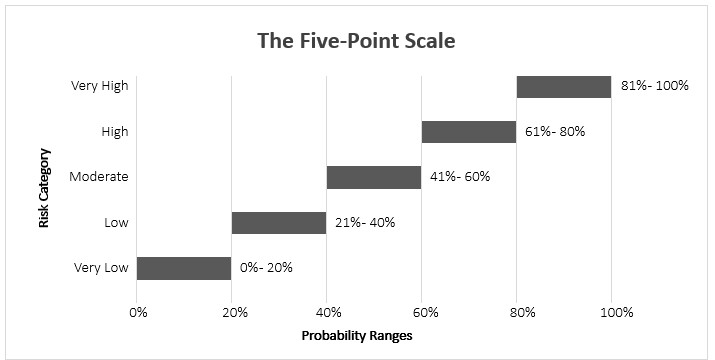
Figure 8 The 5-Point Scale Range Values
By assigning each category a range of probabilities, the level of risk associated with an event or activity can be quantified. When communicating this, you should note that this estimate is based on an initial range of 20% for each.
Benefits of Using the Scale
Using the five-point scale with values of very low, low, moderate, high, and very high is a good way to begin thinking, speaking, and quantifying risk. It provides a simple and intuitive way to express risk that people with different levels of expertise in risk management can easily understand. It also allows for quick and easy consensus-building among different organizational groups.
One of the benefits of using the 1-5 scale is the same as found by L. Hoffman and D. Clement (1970)19, which is the value of using “intuitive linguistic variables” for range variables. Another benefit is a five-point scale avoids the issues found in a three-point scale by allowing wider disbursement among the mid-range values. A simple three-point scale is susceptible to bias (most people are averse to using either the lowest or highest extremes and tend to default to mid-range values).
The conversion of the scale to 20% ranges provides a more precise and objective assessment of risk that can be used to make informed decisions about risk management. This allows for a more systematic and consistent approach to risk management that can help organizations identify, assess, and manage risk.
In addition, using the five-point scale can help promote a risk management culture within an organization. Providing a simple and intuitive way to express risk can encourage employees to think more proactively about risk and take appropriate steps to manage risk in their daily activities.
A five-point scale provides a simple and intuitive way to express risk that people with different levels of expertise in risk management can easily understand. Translating the qualitative descriptors of the five-point scale into corresponding 20% probability ranges enhances the precision of risk evaluations, allowing for a more quantifiable and objective approach to risk assessment. Using this scale can help promote a risk management culture within an organization and aid in consensus-building among different organizational groups.
Back-of-the-Napkin Math
This method is an easy way to quantify risk without advanced tools or models. It approximates an advanced method known as the Monte Carlo Simulation using ranges described in the 5-point scale method. This method produces a usable approximation but lacks the level of detail or ability to generate meaningful probability distribution charts available with the Monte Carlo simulation method. You only need a sheet of paper and a pen or pencil to use this method, which is why I call it the “back-of-the-napkin” method.
The Three-Point Range Values
Using three-point values is a simple and effective way to express a range, such as the level of threat and likelihood associated with an event or activity. The three values are minimum, most likelihood, and maximum.
When we quantify risk, we use the formula Threat x Likelihood = Risk. Each of these (threat, likelihood, and risk) is expressed as a range.
To this equation, we can add the impact as a way to rate the risk. Risk x Impact = Rating
The impact can be financial or operational, and whether the impact is Very High or Very Low is always established by the organization. If the impact is financial it is expressed as a dollar value.
Let’s look at how the three-point values are used to quantify risk.
Assume the threat values of .10, .20, and .30. Then assume the likelihood values are .20, .80, and .60. How do we multiply ranges?
Follow these steps to multiply two 3-value ranges:
- Multiply the first value of the first range by the first value of the second range.
- Multiply the second value of the first range by the second value of the second range.
- Multiply the third value of the first range by the third value of the third range.
[.10 .20 .30] x [.20 .60 .80] = [.10 x .20] [.20 x .60] [.30 x .80]
Now, just give the final three values.
.10 x .20 = .02
.20 x .60 = .12
.30 x .80 = .24
You get the following range [.02 .12 .24].
Now, let’s estimate the range for impact. Assume $10K, $20K, and $50K as the values.
[.20 .16 .18] x [ $10K $20K $50K] = [$2,000 $2,400 $12,000]
.20 x $10,000 = $2,000
.16 x $20,000 = $2,400
.18 x $50,000 = $12,000
Developing a Range Estimate from a Single Point Value
In many instances, you will only have a single-point value, such as the percentage of assets missing a patch. In this case, you can use the single point value as your most likely value and add +/- 10% to get a 20% range.
Example: If 20% of workstations are missing a patch, you could use the +/- 10% to produce the range .10-.20-.30. When using this method, you should note in your communications that this is a +/- 10% estimate based on the initial value of the weakness finding (20% of workstations with a missing patch).
Developing a Range from Multiple Variables.
When you have multiple variables, one approach to establishing your range is to take the highest and lowest values in the set, then establish your mid-point value by subtracting the lowest value from the highest and dividing that value by 2, then add that value to the lowest value. BYJUS.com, a global EdTech firm, has a basic explainer for ranges available at BYJUS.com “Range”. https://byjus.com/maths/range/.
Example: 20% of servers are missing a patch and 45% of servers have a weak configuration that leaves them open to compromise. We can use 20% as the low value and 45% as the high value. To calculate the mid-range value, we subtract the lower value from the higher value (45-20=25) and divide that by 2 (25/2=12.5), then add that to the lower value (20+12.5=32.5). That gives us .20-.32.5-.45.
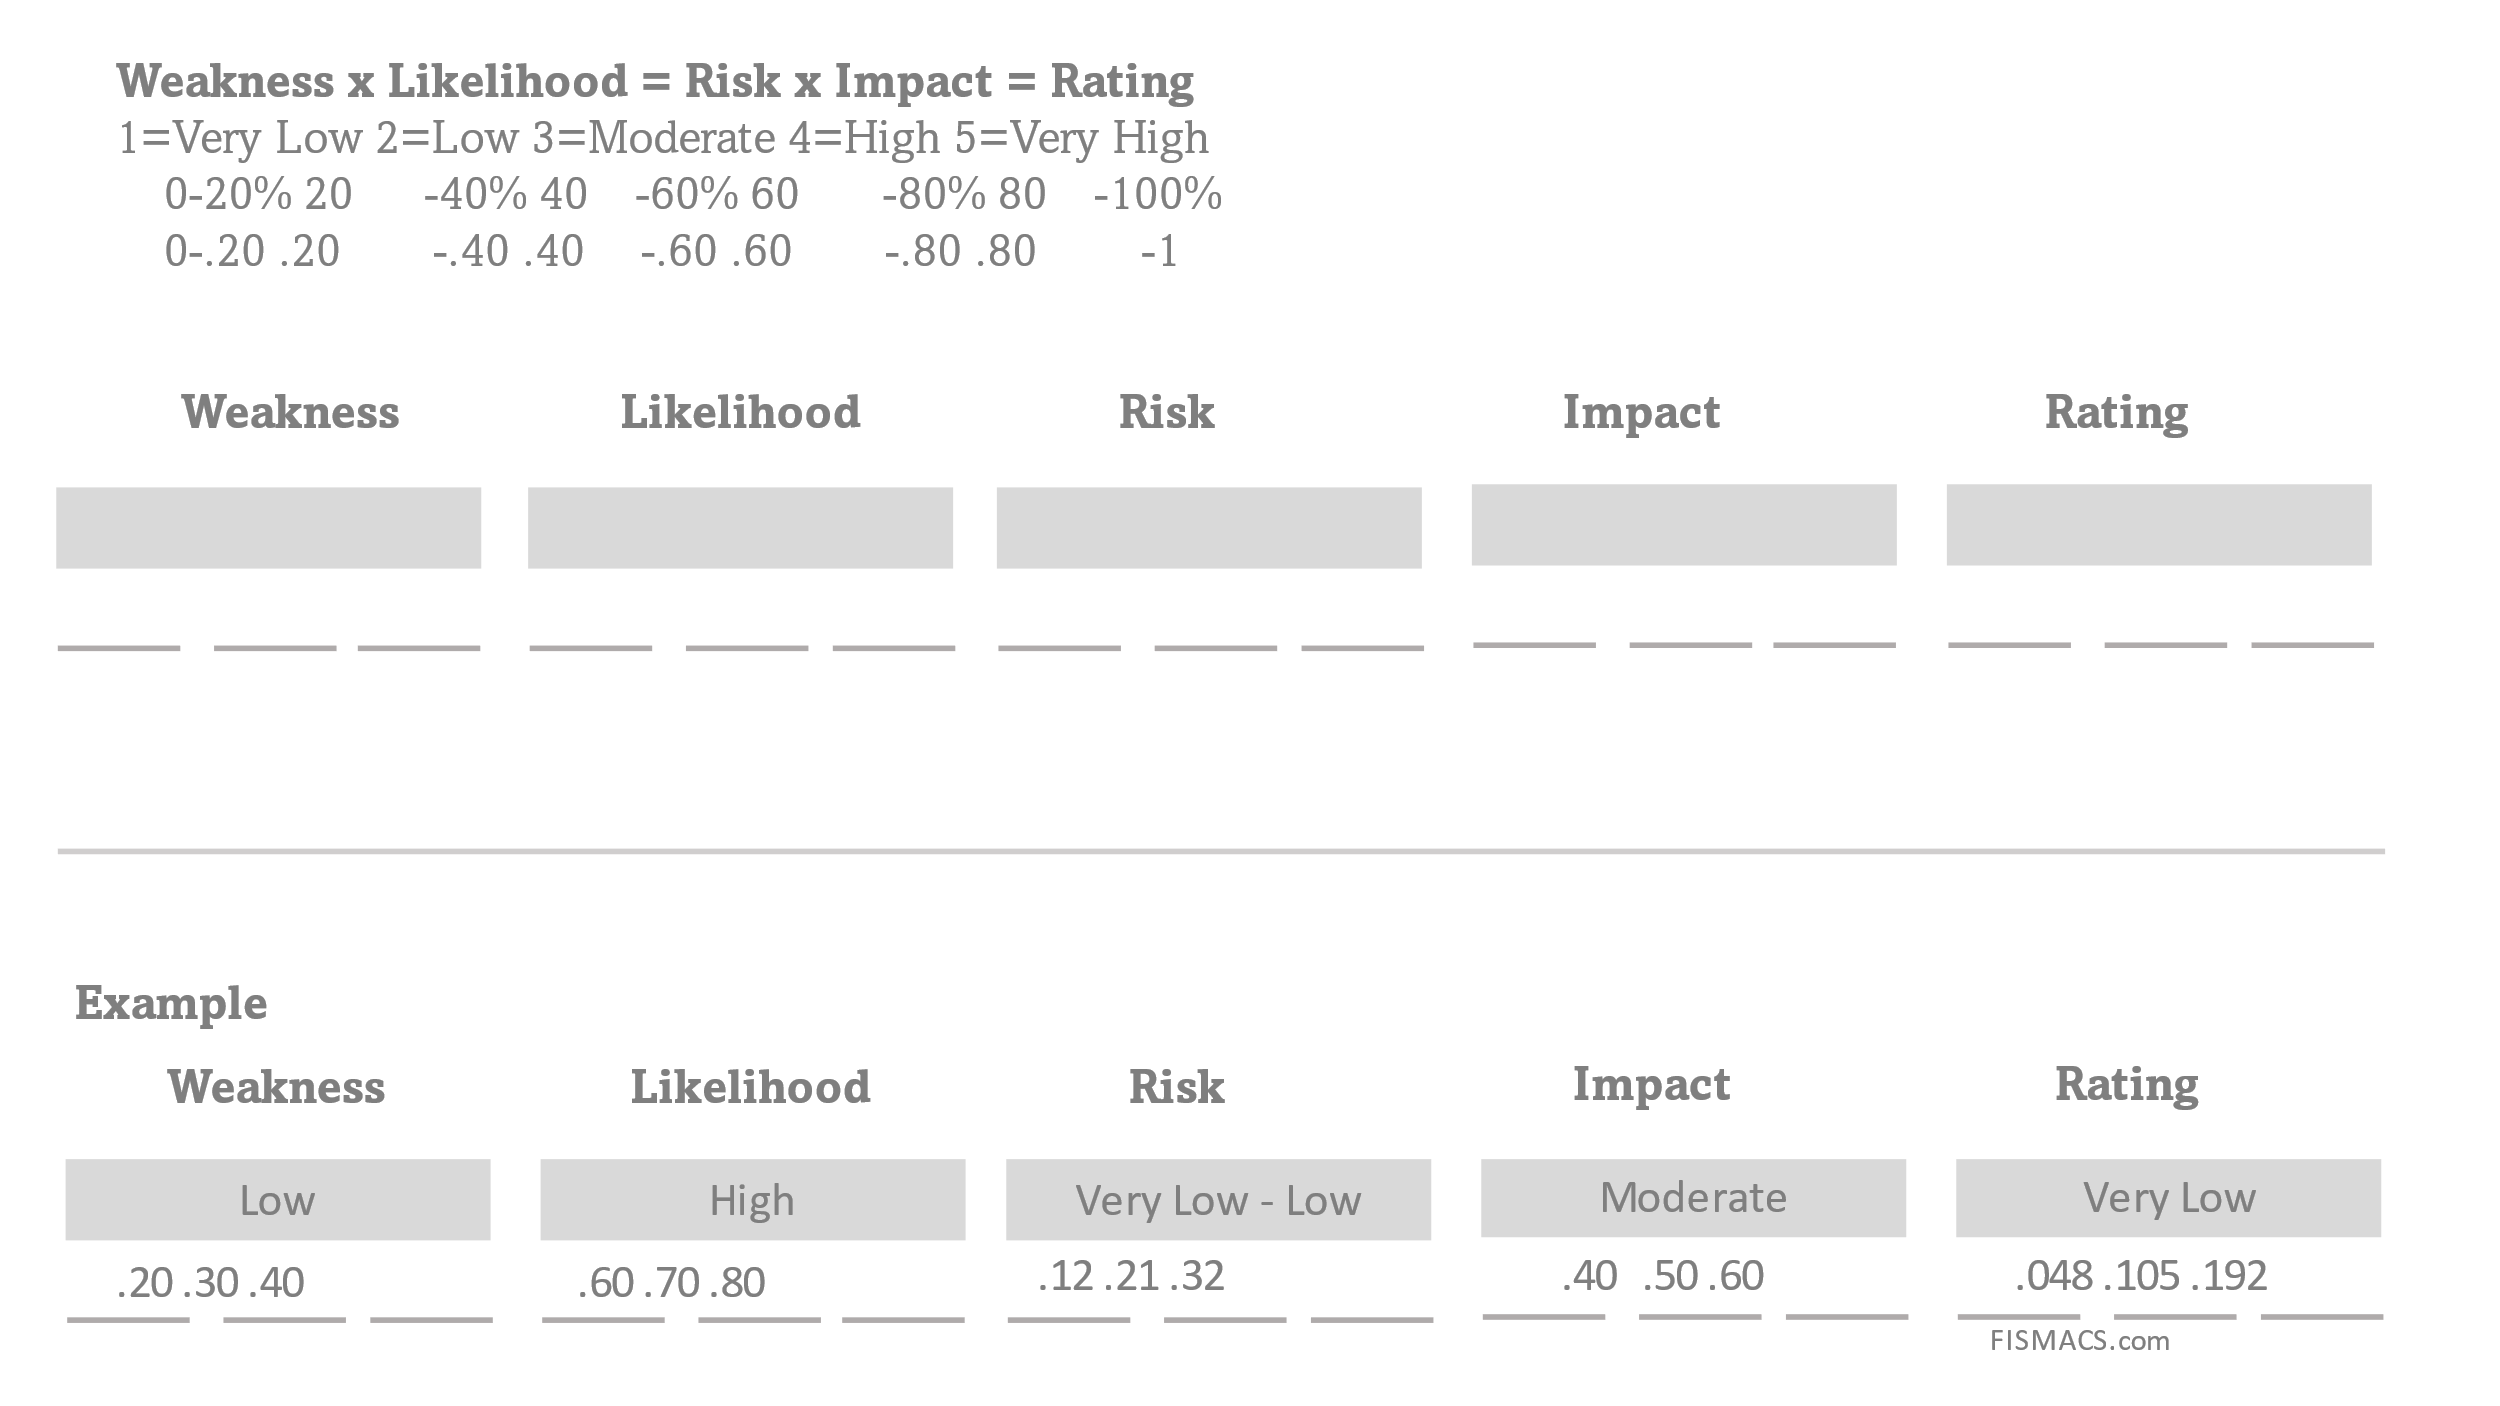
Figure 9 Back-of-the-Napkin Worksheet
Case Studies
For each of the scenarios provided, use the five-point scale to convert estimates of threat (weakness), likelihood (the likelihood that the weakness will be leveraged against the organization), risk, impact (a range of financial cost), and score. Reading and understanding the examples will guide your evaluation process and prepare you for the module quiz and final project.
The Branch Manager
As the branch manager sat in her office, she received an urgent message from the corporate security team about a newly released patch that addressed a critical vulnerability in the company’s network. Concerned about the potential risk to her branch, she immediately contacted the network operations group to inquire about the patch.
The network administrator reviewed the vulnerability data and determined that 28% of their web servers required the patch. She knew that this was a significant number of web servers involved. She also knew that a critical vulnerability on web facing servers posed a high risk to the organization.
However, the operations group could not apply the patch for a week due to other scheduled maintenance. The network administrator explained to the branch manager that the patch required significant testing and validation before being deployed to the production environment. She assured the branch manager that the operations group was working diligently to ensure the patch would be deployed as soon as possible.
Steps:
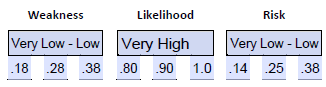
- Assign a range to weakness. In this example, we have a percentage of the threat landscape that is missing a required patch. We can use this as the basis for our initial range for threat. 28% falls within the low range, so we can use this to justify a low rating for weakness. With 28% as a midpoint, we add +/- 10%, giving us a range of .18-.28-.38 for threat.
- Assign a range to likelihood. In the example we are told the missing patch has a critical severity and that it is on web servers. We can review our guidance for establishing an initial estimate and consider the criticality of the vulnerability and location (web servers); we can justify a very high risk range of .80-.90-1.0.
- Set the time period for the estimate. We will use the time period of “until patches are applied”. We could note that the longer this takes the more the likelihood of compromise increases.
- Calculate initial estimate.
University Case Study
The college has always prided itself on its commitment to technology and innovation. With a sprawling campus and a diverse student population, the college relies heavily on its network infrastructure to provide critical services to its students, faculty, and staff.
However, in recent months, the college has experienced several issues with its network infrastructure. Users across the campus had reported slow performance, intermittent outages, and other issues. Concerned about the potential impact of these issues, the college decided to perform an internal audit of its network infrastructure.
The audit revealed a number of significant issues with the college’s network infrastructure. The most pressing issue was that 70% of the college’s workstations required system upgrades due to recent end-of-life notices that hadn’t been tracked. The previous network administrator had recently left, and it had taken some time for the new administrator to come up to speed. As a result, critical updates and patches had been missed, leaving the college’s network vulnerable to potential cyber-attacks.
The new administrator found that there was little network documentation, and in fact, there was little segment across the campus. This meant that if a cyber-attacker were to gain access to one part of the network, they would have access to the entire network.
The new administrator was alarmed by the audit’s findings. She knew that the college’s network was vulnerable to potential cyber-attacks and that urgent action was needed to address the issues.
As she continued to review the network infrastructure, the new administrator read about a recent cyber-attack at another university. In that attack, the threat actor had moved laterally across the network and could compromise and exfiltrate sensitive data from the administration office. The attack had caused significant damage to the university’s reputation and resulted in a loss of trust among students, faculty, and staff.
Steps:
- Assign a range to weakness. In this example, we are given the statistic that 70% of workstations are on an unsupported operating system version. We can use this percentage of the threat landscape (workstations) as the basis for an initial estimate. Using 70 as our mid-range value, we get .60-.70-.80, which is moderate to high.
- Assign a range to likelihood. For likelihood, we consider the network’s lack of segmentation and documentation and the recent attack on another university in which this weakness was leveraged, resulting in the exfiltration of sensitive data. This activity raises the likelihood that the university would be a target. We can use a range of very high, giving us .80-.90-1.0.
- Calculate the risk value.
- Assign a range to impact. We can consider the impact experienced by the recent attack at another university as a potential impact on this university, given the lack of segmentation and documentation. We also know that 70% of workstations (including administrative) use an unsupported operating system. Combined, we can justify a very high impact range of .80-.90-1.0.
- Calculate risk rating.
- Indicate applicable time period. We considered two key variables: vulnerable workstations and lack of network segmentation. Both of these would need to be addressed to change the risk, impact, or rating. When we indicate our applicable time periods, we need to note this and state that this estimate is applicable until these weaknesses are sufficiently addressed.
Health Care Facility Case Study
As the HIPAA compliance auditor arrived at the healthcare provider, she was ready to conduct a thorough audit of their HIPAA compliance measures. The healthcare provider hired an auditor to identify any systems vulnerabilities and provide recommendations for improvement.
As the auditor began her assessment, she quickly identified several areas of concern. She discovered that over 60% of the staff were not provided with HIPAA compliance training. The auditor found that the healthcare provider had not implemented a comprehensive training program to educate their staff on HIPAA compliance policies and procedures. This presented a significant risk, as the staff may unknowingly violate HIPAA regulations, leading to potential legal and financial liabilities.
In addition, the auditor found that 12% of the staff did not have dedicated laptops. This created a risk of unauthorized access to patient information, as multiple staff members with varying degrees of “need to know” shared laptops, potentially allowing staff who did not have the “need to know” to access patient records.
The auditor also discovered that 48% of the logging system was missing or inoperable due to some network configurations that were only partially implemented. This meant that the healthcare provider could not track and monitor access to patient records. This potentially meant that they could have a privacy violation or loss of sensitive information and not be aware of the violation, which could expose them to civil penalties or even criminal charges.
The auditor also found that patient data was not partitioned from other data on the network. This presented a significant risk, as the healthcare provider’s network could be compromised by external threat actors, and the lack of data partitioning could allow lateral movement, resulting in sensitive data being stolen or ransomed.
After compiling her assessment, the auditor estimated that the healthcare provider’s HIPAA compliance posture did have significant weaknesses, with a significant risk of unauthorized internal access. She noted that the lack of HIPAA compliance training, the inadequate number of workstations, the missing logging system, and the lack of data partitioning presented a significant risk of HIPAA violations and data breaches. She estimated that the healthcare provider’s legal liability from the identified weaknesses could be significant, as the provider could be held responsible for any financial losses or damages suffered by patients due to the breach.
The auditor’s report included detailed recommendations for the healthcare provider to improve their HIPPA compliance measures. She advised the provider to implement a comprehensive HIPPA compliance training program to educate their staff on HIPPA regulations and procedures. She also recommended that the provider increase the number of laptops from 132 to 150 to ensure that patient records were not left unintentionally exposed to staff that lacked the “need to know.”
To address the missing logging system, the auditor recommended that the healthcare provider implement a comprehensive system that tracks and monitors access to patient records. She advised the provider to implement least privilege role-based access controls and appropriate network segmentation to separate patient data from other network data.
The estimated cost to implement the auditor’s recommendations was significant. The healthcare provider would need to invest between $50,000 to $100,000.
Steps:
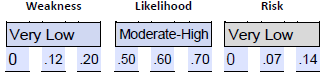
- Estimate the weakness. We can use the 12% estimate of missing laptops as the basis for estimating the weakness as a percentage of the threat landscape. We can use a very low estimate of 0-.12-.22. The lack of sufficient data separation was linked to the risk of external threat actors moving laterally and potentially stealing or ransoming sensitive data. The lack of logging is of concern, but it is not a weakness that can be leveraged to result in an attack. Rather, it results in a lack of visibility and awareness.
- Estimate the likelihood. We can use the 60% of staff lacking the training to estimate the likelihood of inadvertent unauthorized access to patient-sensitive data. We could use a .50-.60-.70 range or moderate to high. We have insufficient data to estimate the likelihood of an external attack because no relevant weaknesses were identified in the audit.
- Estimate the risk.
Accounting Firm Case Study
The cybersecurity auditor arrived at the accounting firm of Smith and Associates, ready to conduct a thorough audit of their cybersecurity measures. The firm hired the auditor to identify any systems vulnerabilities and provide recommendations for improvement.
As the auditor began his assessment, he quickly identified several areas of concern. He discovered that 67% of the firm’s workstations had outdated software, including operating systems and applications. This presented a significant risk, as obsolete software can contain known vulnerabilities that cyber-attackers can exploit.
In addition, the auditor found that 29% of the workstations had outdated anti-virus software. This was a significant concern, as anti-virus software is the first line of defense against malware and other cyber threats. Outdated anti-virus software can be ineffective against new and emerging threats, leaving the firm’s systems vulnerable to attack.
The auditor also discovered that the firm’s public-facing web server had multiple SQL vulnerabilities. SQL vulnerabilities are a common target for cyber-attackers, as they can be exploited to gain unauthorized access to databases and steal sensitive data. The auditor was particularly concerned about this vulnerability, as it posed a significant risk to the firm’s clients and their confidential financial information.
After completing his assessment, the auditor stated that the firm’s cybersecurity posture has several significant weaknesses that could likely be leveraged in an attack. He noted that the outdated software and anti-virus, combined with the SQL vulnerabilities on the public-facing web server, created a significant risk of cyber-attack. He recommended that the firm immediately address these vulnerabilities and improve its cybersecurity posture.
According to a recent report by IBM, the average data breach cost is $3.86 million. This includes costs associated with detecting and containing the breach, notifying affected individuals, and providing identity theft protection services. The report also found that the cost per lost or stolen record containing sensitive information was $180.
If the accounting firm suffered a data breach, the financial impact could be substantial. For example, if the attackers had stolen 10,000 client records, the cost of the breach could have been $1.8 million.
Steps:
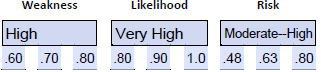
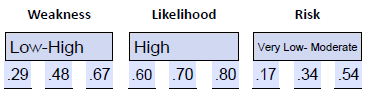
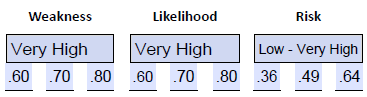
- Estimate the weakness. We have two weaknesses related to the workstations: 67% are using outdated operating systems and applications, and 29% have outdated anti-virus. We subtract the lowest value from the highest value (67-29=38) and divide that by 2 (38/2=19), then add that to the lowest value (29+29=48). That gives us the range of .29-.48-.67, which is low-high. We have one web server with an SQL vulnerability, which we consider very high by default. That range is .80-.90-1.0.
- Estimate the likelihood. For the workstations we will estimate the likelihood as high or .60-.70-.80. We will estimate the likelihood of compromise for the web server as very high or .80-.90-1.0.
- Estimate the risk.
- For the workstations
- For the web server
- For the workstations
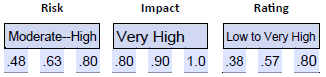
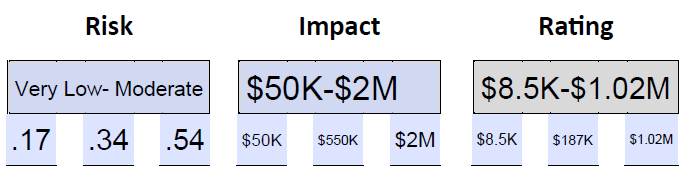
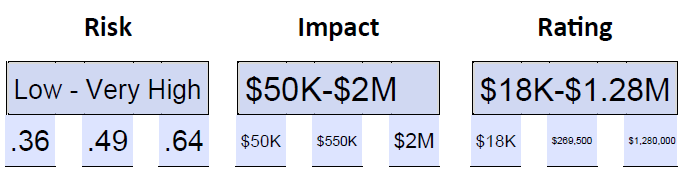
- Estimate the risk rating for workstations and web server, each based on a $50,000, $550,000, and $2,00,000 cost range. Compare to determine which source is more likely to result in a higher financial impact. In this example we are not splitting the financial cost between two probable risk sources, rather we’re comparing the two potential sources of a potential data breach with a single potential financial impact and comparing the resulting rating which is given in financial terms.
-
- For the workstation
- For the web server
- For the workstation
