
Module 3: Case Studies & Examples
A Simple Attack Scenario Model
This model is focused on factors considered to estimate weakness and likelihood of compromise. It is best used with a risk scenario which lays out the various factors you will consider. These factors are part of the scenario. The scenario may be used to walk through a process or procedure. One of the best ways to use this model is using an attack as your scenario. In this way you will be forecasting the likelihood of the attack succeeding.
You could use this model to also measure reduction of risk by performing the analysis twice, once before any remediation and again after the remediation. In this way you will be able to measure the individual factors before and after and present the comparison as the measure of risk reduction.
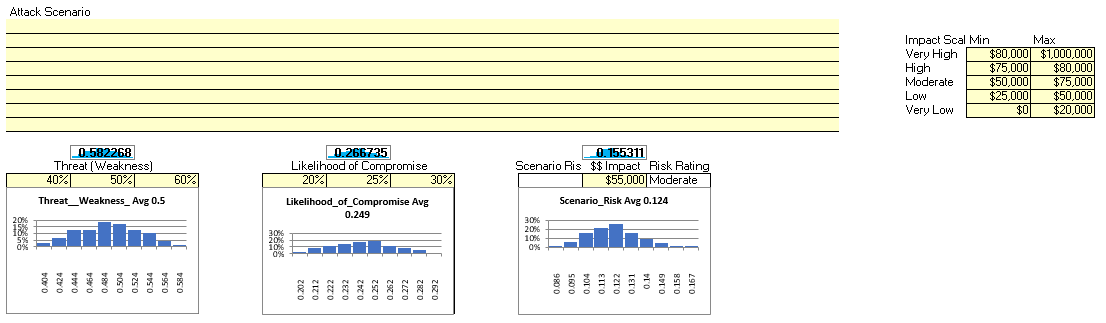
Figure 25 Attack Scenario Model
How to use this model
Here are the steps to using this model.
- Describe your attack scenario. This is a free-form text field. Here you can describe the attack scenario, stages and tactics. You can include any vulnerability data analysis findings. Describe any factors you considered such as industry data or statistics. Describe any factor weightings or range aggregation you applied.
- Input your threat range (minimum – most likely – maximum)
- Input your likelihood range (minimum – most likely – maximum)
- The model will calculate risk range.
- Input your financial impact range value (upper right hand range values for Very High to Very Low).
- Input your estimate of the financial impact (lower right-hand impact box). Based on your estimate of financial impact and the financial impact range from the previous step, the model will auto-fill the impact rating (rating will be listed beside your estimate of financial impact)
Case Study: Retail System Compromise Analysis
Your boss has asked you to develop an estimate of the likelihood that the small chain of retail outlets might experience a severe cyber-attack like the one recently in the news.
You begin by looking at industry data (Verizon DBI) to get an idea of overall trends and top patterns. You see a 47.5% frequency of incidents with confirmed data disclosure, external threats dominate, and system intrusion such as basic web application attacks and social engineering are among the top attack patterns.
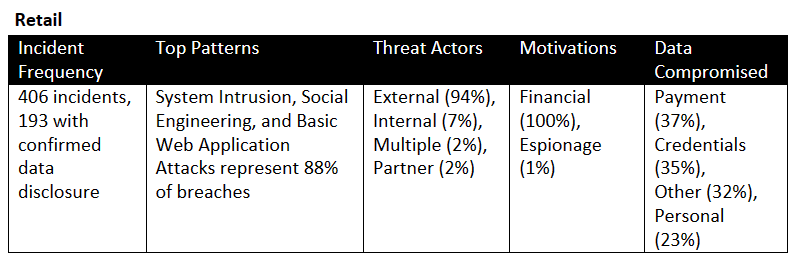
Figure 26 Retail Industry Statistics
You pull vulnerability data from all four locations. You find that 5% of the servers are missing recently released patches. You don’t find any major issues with perimeter defense, but the back-office laptops and servers do have some issues. 35% of the workstations have out-of-date anti-virus signatures and scan findings that could lead to initial access, primarily in the area of weak access control and missing application patches. You know your organization doesn’t have robust cybersecurity awareness training. When you speak to operations, they tell you that they regularly deal with up to 5 malware incidents per month, but nothing serious.
You decide to focus on the risk of user workstation/laptop intrusion. You estimate your weakness at 35% +/- 10% giving you a range from 25-35-45. You estimate the likelihood of compromise at very low but skew it to the lower end using a range of 1-5-20.
For the financial estimate, you use a public estimate of $130/record cost from data breach and estimate 30% of records might be compromised. You estimate 5,000 customers per month for 60,000 records. At 30% compromised per $130/record cost that’s a potential loss of $2,340,000 which is in line with the industry estimates for the average retail loss.
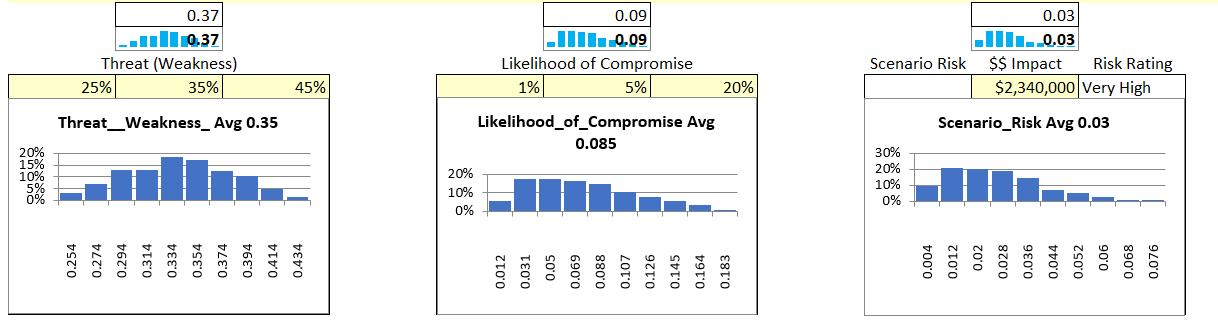
Figure 27 Retail Attack Scenario
Health Care Facility Case Study
Let us revisit a case study from module 2, the Health Care Facilities Case Study. In this previous example we estimated risk using the five-point scale and three-point values. Let’s review the case and then use the Attack Scenario model instead.
As the HIPAA compliance auditor arrived at the healthcare provider, she was ready to conduct a thorough audit of their HIPAA compliance measures. The healthcare provider hired an auditor to identify any systems vulnerabilities and provide recommendations for improvement.
As the auditor began her assessment, she quickly identified several areas of concern. She discovered that HIPAA compliance training was not provided to over 60% of the staff. The auditor found that the healthcare provider had not implemented a comprehensive training program to educate their staff on HIPAA compliance policies and procedures. This presented a significant risk, as the staff may unknowingly violate HIPAA regulations, leading to potential legal and financial liabilities.
In addition, the auditor found that 12% of the staff did not have dedicated laptops. This created a risk of unauthorized access to patient information, as multiple staff members with varying degrees of “need to know” shared laptops, leading to the potential for patient records to be accessed by staff who did not have the “need to know”.
The auditor also discovered that 48% of the logging system was missing or inoperable due to some network configurations that were only partially implemented. This meant that the healthcare provider could not track and monitor access to patient records. This potentially meant that they could have a privacy violation or loss of sensitive information and have no awareness of the violation. This could expose them to civil penalties, or even criminal charges.
The auditor also found that patient data was not partitioned from other data on the network. This presented a significant risk, as the healthcare provider’s network could be compromised by external threat actors and the lack of data partitioning could allow lateral movement resulting in sensitive data being stolen or ransomed.
After compiling her assessment, the auditor estimated that the healthcare provider’s HIPAA compliance posture did have significant weaknesses, with a significant risk of unauthorized internal access. She noted that the lack of HIPAA compliance training, the inadequate number of workstations, the missing logging system, and the lack of data partitioning presented a significant risk of HIPAA violations and data breaches. She estimated that the healthcare provider’s legal liability from the identified weaknesses could be significant, as the provider could be held responsible for any financial losses or damages suffered by patients due to the breach.
The auditor’s report included detailed recommendations for the healthcare provider to improve their HIPPA compliance measures. She advised the provider to implement a comprehensive HIPPA compliance training program to educate their staff on HIPPA regulations and procedures. She also recommended that the provider increase the number of laptops from 132 to 150 to ensure that patient records were not left unintentionally exposed to staff that lacked the “need to know”.
To address the missing logging system, the auditor recommended that the healthcare provider implement a comprehensive system that tracks and monitors access to patient records. She advised the provider to implement least privilege role-based access controls. She also recommended the provider implement appropriate network segmentation to separate patient data from other data on the network.
The estimated cost to implement the auditor’s recommendations was significant. The healthcare provider would need to invest between $50,000 to $100,000.
Steps:
- Estimate the weakness. We can use the 12% estimate of missing laptops as the basis for an estimate of the weakness as a percentage of the threat landscape. We can use a very low estimate of 0-.12-.22. The lack of sufficient separation of data was linked to a risk of external threat actors moving laterally and potentially stealing or ransoming sensitive data. The lack of logging is of concern, but it is not a weakness that can be leveraged to result in an attack. Rather, it results in a lack of visibility and awareness.
- Estimate the likelihood. We can use the 60% of staff lacking training to build an estimate of the likelihood of inadvertent unauthorized access to patient sensitive data. We could use a .50-.60-.70 range or moderate to high. We have insufficient data to estimate the likelihood of an external attack because no relevant weaknesses were identified in the audit.
- Estimate the risk.
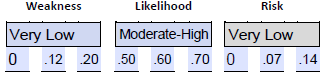
Now let’s plug these values into our estimate values into the attack model.
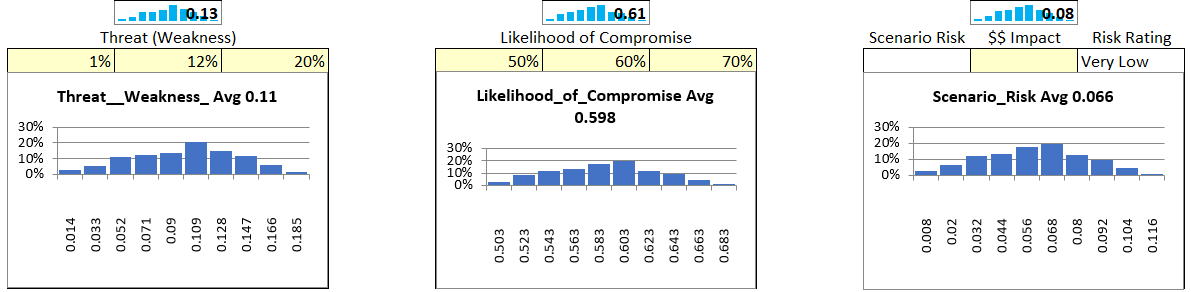
Figure 28 Attack Scenario Exercise Results
Notice we have input the Threat and Likelihood ranges. The results are displayed in the probability distribution for risk. The average risk value is 6.6%.
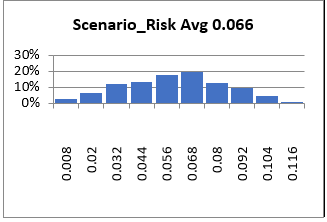
Figure 29 Attack Scenario Risk Distribution Output
Notice we followed the same process, using the same case study. The only thing we’ve changed here is the use of the attack model because it generates probability distributions rather than using the manual 3-point calculation.
Probability distributions do not substantially change the results of the 3-point value estimate, rather they provide a better visualization of how the probable values within the range you’ve set are most likely to be distributed based on the minimum, most likely and maximum values you established.
Did you notice how the values in this case study are evenly distributed but we skewed the values in the prior case study? The use of probability distributions to graphically represent the data is important when it comes to communicating your findings and estimates. We’ll dive into the use of probability distributions more in later modules.
