
Module 3: Terminology & Concepts
Quantifying the top business risk, cyber-attacks.
In today’s digital age, cyber risk is a top business risk that organizations must address to protect their operations, reputation, and financial stability. Risk quantification plays a critical role in supporting critical business decisions by providing organizations with a clear understanding of their exposure to cyber-attacks and helping them make informed decisions about allocating their resources to reduce that risk. This section explores the importance of quantifying the risk of cyber-attack in supporting business decisions and minimizing the impact to the business.
Business Decisions Supported by Risk Quantification
- Resource Allocation: Risk quantification helps organizations identify and prioritize cyber risk management efforts. By understanding their risk exposure, organizations can allocate resources to the areas with the most significant risk. This ensures that resources are used effectively and efficiently to reduce cyber risk.
- Risk Management Strategy: Risk quantification helps organizations develop and implement effective risk management strategies. By understanding their risk exposure, organizations can develop strategies tailored to their specific needs and risk profile. This ensures that risk management efforts are effective in reducing cyber risk.
- Business Continuity: Risk quantification helps organizations ensure business continuity during a cyber-attack. By understanding their risk exposure, organizations can develop contingency plans and disaster recovery strategies tailored to their specific needs and risk profile.
When we quantify cyber risk, we are forecasting the likelihood of a negative event occurring. Understanding how vulnerabilities, compliance, procedures and other factors contribute to that likelihood are important for business leaders to understand. This information is useful in leading to mitigation strategies and increased security. But it is the potential impact from the event that truly drives business decisions. A highly likely negative cyber event with little or no impact on the business operation is probably of little interest to executives. This is why you will want to consider including an estimate of impact when presenting it to executives. The ability to quantify the impact is key to effectively communicating the risk. Not only do you want to quantify the impact but consider how this aligns with the business objectives. Some organizations prioritize financial impacts while others prioritize operational or reputational impacts. Understanding the business objectives and your ability to align risks and impacts accordingly will make you effective in communicating cyber risk.
Impacts of Cyber Risk
- Financial Impact: A data breach can include direct costs, such as legal fees and remediation costs, as well as indirect costs, such as lost revenue and damage to brand reputation.
- Operational Impact: A successful attack can disrupt operations, cause downtime, and lead to a loss of productivity.
- Reputational Impact: A successful attack can damage an organization’s brand reputation, leading to a loss of customer trust and loyalty.
- Regulatory Impact: Failure to protect sensitive data can result in legal penalties and regulatory fines.
Remember, risk quantification is an ongoing process. When the threat landscape changes, business objectives change, or there is new data you should revisit your analysis and update your forecasts accordingly.
The Analysis Process
Quantifying risk follows a basic analysis process. While there may be many unique and intermittent steps, the basic process consists of scoping the project, measuring the threat, and estimating the likelihood.
Scoping
The first step in the risk analysis process is scoping, which involves defining the boundaries of the analysis and identifying the assets, processes, and systems that will be evaluated. This step is crucial to ensure the analysis is focused and that the correct amount of effort will be applied.
One of the myths about risk quantification is that it is time consuming and expensive. When you hear someone saying this, you know that they don’t understand how to properly scope the analysis. It’s best practice to always perform an initial analysis first. An initial analysis is quick, cost-effective and generates an initial estimate of risk. This allows executives to make the decision whether to continue, or whether the initial analysis is sufficient to support their decision-making process. In this way, risk quantification becomes inexpensive and far more useful.
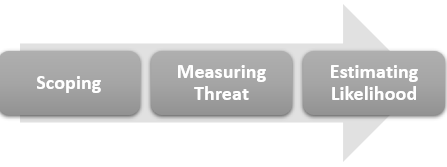
Figure 22 The Analysis Process
During the scoping process you will want to identify the threat scenario(s) you will evaluate. Scenarios are the preferred method of analyzing the risk of cyber-attacks. Your scenario will closely align to the specific attack tactics, and identify organizational resources and procedures involved.
Measuring Threat
Once the scope of the analysis has been defined, the next step is to measure the threat. We use the term threat to refer to any situation, weakness or vulnerability that a threat actor could leverage to create an event (successful attack) with a negative outcome, such as financial loss, reputational damage, or operational disruption.
Measuring threats involves first identifying vulnerabilities an attacker could exploit. This can be done through various methods, such as vulnerability assessments, threat modeling, and scenario analysis.
Methods for Measuring Threat
- Vulnerability analysis involves identifying weaknesses in the organization’s systems, processes, and infrastructure that an attacker could exploit. This can be done through various techniques, such as analyzing system vulnerability data and reviewing prior assessment reports or system documentation.
- Threat modeling involves identifying potential attackers, their motivations, and the methods they might use to exploit vulnerabilities. This can help identify the most likely attack vectors, techniques, and exploitation pathways.
- Scenario analysis involves developing hypothetical scenarios in which a risk event could occur and assessing the event’s potential impact on the organization. This can help to identify the most critical risks and prioritize risk mitigation efforts. You can leverage known tactics of specific attacks as the basis of building your scenarios.
- Prior assessment findings are a valid source for measuring threats. Assessment reports identify weaknesses that can readily be used to quantify risk.
Each of these methods helps you compile your list of threats. Each is a factor you will consider when you begin developing your estimate.
Estimating Likelihood
The final step in the risk analysis process is to estimate the likelihood of a risk event occurring. Likelihood refers to the probability that a risk event will occur and is typically expressed as a percentage or a probability distribution. Think of it as the likelihood that a threat actor is able to leverage the threat against the organization.
Estimating likelihood typically involves analyzing historical data, expert judgment, and other relevant information to develop a probability estimate. This can be done through various methods, such as statistical analysis, expert elicitation, and simulation.
Methods for Estimating Likelihood
- Statistical analysis involves analyzing historical data to identify patterns and trends and then using this information to develop a probability estimate for future events. This can be done using various statistical techniques, such as regression analysis, time series analysis, and Bayesian inference.
- Expert elicitation involves soliciting the opinions of subject matter experts to develop a probability estimate. This can be done through various techniques, such as Delphi surveys, structured expert judgment, and probabilistic risk assessment.
- Simulation involves using computer models to simulate the behavior of complex systems and processes and then using this information to develop a probability estimate. This can be done using various simulation techniques, such as Monte Carlo simulation, discrete event simulation, and system dynamics.
We use the formula Threat x Likelihood = Risk to calculate the risk of a negative event occurring. This can then be combined with potential impact estimates to rate the risk.
Analysis vs. Assessment
Risk analysis and risk assessments are two approaches to managing risk commonly used in organizations. While both approaches aim to identify and manage risks, their focus, methods, and outcomes differ.
Risk Analysis
Risk analysis is a process that involves identifying, assessing, and prioritizing potential risks to an organization’s operations, reputation, and financial stability. The goal of risk analysis is to provide decision-makers with the information they need to make informed decisions about how to manage risks.
One common risk analysis approach is using probabilistic methods to quantify risk. This involves measuring the threat posed by potential risks and the likelihood of the risk event occurring. These measures can then be combined to calculate the overall risk level.
Measuring threat involves identifying the potential sources of harm and vulnerabilities an attacker could exploit. This can be done through various methods, such as vulnerability assessments, threat modeling, and scenario analysis.
Estimating likelihood typically involves analyzing historical data, expert judgment, and other relevant information to develop a probability estimate. This can be done through various methods, such as statistical analysis, expert elicitation, and simulation.
Once the likelihood of a risk event has been estimated, it can be combined with the estimated threat to calculate the overall risk level. This can be done using a variety of risk formulas, such as the risk matrix, the risk equation, or the risk tree.
The outcome of risk analysis is typically a set of prioritized risks, along with recommendations for managing these risks. This may include risk mitigation strategies, risk transfer mechanisms, or risk acceptance decisions.
Risk Assessments
Risk assessments, on the other hand, are typically related to compliance and regulatory requirements. A risk assessment aims to identify and assess potential risks to an organization’s compliance with legal, regulatory, and contractual obligations.
Risk assessments typically involve systematically reviewing an organization’s policies, procedures, and controls to identify potential compliance risks. This may include reviewing contracts, laws, and regulations that apply to the organization and analyzing its internal controls and processes.
The outcome of a risk assessment is typically a set of identified compliance risks, along with recommendations for managing these risks. This may include changes to policies and procedures, enhanced monitoring and reporting, or other measures to mitigate compliance risks.
Key Differences
While both risk analysis and risk assessments aim to identify and manage risks, the two approaches have several key differences.
Key Differences
- Focus: Risk analysis focuses on identifying and managing risks to an organization’s operations, reputation, and financial stability. Risk assessments focus on identifying and managing risks to an organization’s compliance with legal, regulatory, and contractual obligations.
- Methods: Risk analysis typically involves using probabilistic methods to quantify risk, such as measuring threat and likelihood. Risk assessments typically involve a systematic review of an organization’s policies, procedures, and controls to identify potential compliance risks.
- Outcomes: The outcome of risk analysis is a measurement of risk, often expressed as threat x likelihood. It typically identifies impact in operational or financial terms. The outcome of a risk assessment is a report of weakness in terms of compliance with prescribed checks, along with recommendations for managing these risks.
- Drivers: Risk analysis is typically driven by the need to manage risks to an organization’s operations, reputation, and financial stability. Risk assessments are typically driven by the need to comply with legal, regulatory, and contractual obligations.
Risk analysis and risk assessments are two approaches to managing risk that differ in focus, methods, and outcomes. While both approaches aim to identify and manage risks, they are driven by different needs and use different methods to achieve their goals. Organizations can develop effective risk management strategies that address operational and compliance risks by understanding the differences between these approaches.
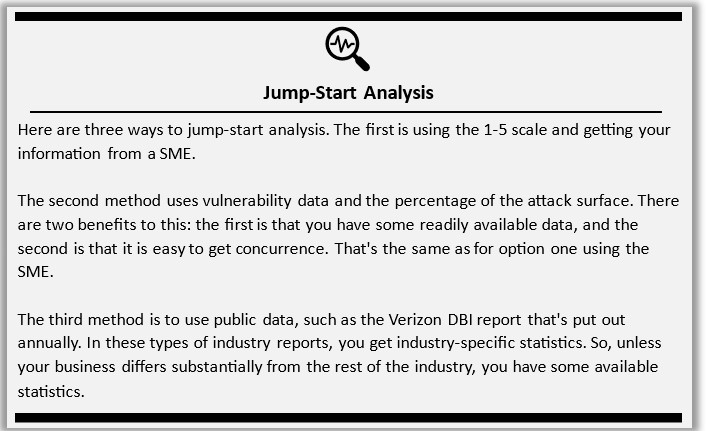
Figure 23 Jump Starting Analysis
Risk and Impact
Risk and impact are two important concepts in risk management that are often interchangeable. While they are related, they are not the same thing. In this section, we will explore the difference between risk and impact and how the joint probability of threat and likelihood can be multiplied by an impact value to rate the risk.
Risk
Risk is the product of the probability of an event (threat x likelihood) and its potential consequences (impact). In risk management, risk is often expressed as a combination of the likelihood of an event occurring and the impact of that event. The likelihood of an event occurring is often expressed as a probability, which is a measure of the chance that the event will occur. The impact of an event is often expressed as a measure of the harm that the event could cause.
For example, the risk of a cyber-attack on a company’s network could be expressed as the probability of the attack occurring multiplied by the potential impact of the attack. The probability of the attack occurring could be estimated based on historical data, expert opinions, or statistical analysis. The attack’s potential impact could be estimated based on the potential harm that could be caused, such as data loss, financial loss, or damage to the company’s reputation.
Impact
Impact is the effect of an event on an organization or system. In risk management, impact is often expressed as a measure of the harm that an event could cause. The impact of an event can be measured in various ways, depending on the nature of the event and the organization or system that is affected.
For example, the impact of a natural disaster on a community could be measured in terms of the number of people affected, the amount of property damage, and the economic impact on the community. The impact of a cyber-attack on a company’s network could be measured in terms of the amount of data loss, the financial impact on the company, and the damage to the company’s reputation.
Using the Impact to Rate the Risk
When we quantify risk, we use the equation “Threat x Likelihood = Risk”. Impact is a value we use to rate the risk. The higher the impact the higher the criticality of the risk. Often people confuse rating a risk with calculating the risk (threat x likelihood = risk). In this course we clearly separate the two seps of quantifying the “RISK” and then calculating the impact.
While quantifying risk is a standard equation that can be applied to any type of risk, calculating impact is subjective. Every organization will have a different sensitivity or risk appetite and therefore will have a different measure for an acceptable or unacceptable impact level. This is why impacts are always determined by the organization. You must consult with the organization to understand their risk tolerance (their measure of acceptable or unacceptable impacts).
Let’s look at an example. If we estimate the probability of an attack occurring to be 0.3 and the potential financial impact to be $1 million then we would multiply 0.3 x $1 million and get $300,000 as the Risk of Financial Loss.
Threat x Likelihood = Risk (of occurrence)
Risk of occurrence x potential impact = Risk of financial loss
The term Risk may be used to refer to both the risk of an event occurrent, and the risk of a potential financial or operational loss. You will need to be aware of the many different ways that the term Risk can be used.
The Relationship Between Vulnerability Data, Compliance, and Cyber-attacks
Cyber-attacks are a constant threat to individuals and organizations alike. With new vulnerabilities discovered daily, businesses must stay up to date on the latest security measures to protect their sensitive data. This is where vulnerability data and compliance come into play.
Vulnerability data refers to information about the weaknesses in a system or application that cybercriminals can exploit. This data can be gathered through various means, including vulnerability scans, penetration testing, and bug bounty programs. Once vulnerabilities are identified, they can be addressed through software patches, configuration changes, or other remediation efforts.
Compliance, on the other hand, refers to adhering to industry or government regulations and standards related to cybersecurity. While compliance requirements can vary depending on the industry and location of the organization, they typically involve measures such as regular vulnerability assessments, access controls, and incident response plans.
The relationship between vulnerability data and compliance is a close one. Vulnerability data is often used to inform effectiveness of compliance efforts, providing insight into where an organization may fall short regarding security. For example, suppose a vulnerability scan reveals that a company’s website is using an outdated version of a content management system. In that case, this information can be used to update the system and bring the organization into compliance with relevant regulations.
Compliance is not a guarantee of security. Just because an organization complies with all relevant regulations does not mean it is immune to cyber-attacks. Compliance can sometimes create a false sense of security, as organizations may assume they are fully protected because they have met specific requirements.
Regular vulnerability assessments can help organizations identify new threats and stay ahead of cybercriminals. By proactively addressing vulnerabilities, organizations can reduce their risk of a successful cyber-attack.
Cyber-attacks can significantly impact an organization’s reputation and bottom line. In addition to the direct costs of remediation efforts and lost productivity, businesses may face legal fees, regulatory fines, and damage to their brand image.

Figure 24 Addressing Owner Concerns
Developing Attack Scenarios
Scenarios are the preferred method for analyzing risk, especially when considering the risk of a cyber-attack. Once you have performed vulnerability data analysis, a risk scenario is a good way to justify the likelihood of the vulnerabilities being leveraged against the organization.
There are many data sources and alternative approaches to developing an attack scenario. Below are some suggestions for consideration.
Attack Scenarios
An attack scenario is just a sequence of events, much like a story, which walks through the execution of the attack. You can decide which stages to focus on, whether you estimate the success of each stage or just the ultimate success or failure of the attack. As with telling a story, you can decide how detailed you want to be. Remember that we suggest always starting with an initial estimate then diving into a more detailed analysis once leadership has approved the expenditure of resources. So, as you work through this section and review the many sources and methods of developing your attack scenarios, consider first focusing on the main stages of the attack and the main tactics. Keeping your description of tactics basic, at a high-level, will allow you to move more easily through the scenario. Your goal in developing your attack scenarios is to support the analysis of risk.
Attack scenarios are used to identify the potential risks associated with a particular vulnerability and determine the likelihood of an attack.
Attack scenarios are typically created by understanding both the tactics, techniques, and procedures (TTPs) of attackers, as well as understanding the current vulnerabilities present in a system. This is why we advocate vulnerability data analysis as part of your risk analysis process.
A good scenario is one that closely matches known vulnerabilities to the attack tactics.
Analyzing Current Attacks
Analyzing current attacks in the news is an effective way to stay up to date on the latest attack techniques and vulnerabilities, and they can be used as the basis for attack scenarios. By reading news articles and reports about recent attacks, organizations can gain insight into the tactics, techniques, and procedures (TTPs) used by attackers and the vulnerabilities they exploit.
For example, if a news article reports on a recent ransomware attack that exploited a vulnerability in a certain type of software, an organization can use this information to assess its vulnerability to similar attacks.
Decomposing Current Attacks
Decomposing current attacks involves breaking down the attack into its individual components to identify the exploited vulnerabilities. This process involves analyzing the attack to identify the initial entry point, the techniques used to gain access and move laterally within the network, the data that was targeted, and the techniques used to exfiltrate the data.
By decomposing current attacks, organizations can better understand the specific tactics, techniques, and procedures used by attackers and the current vulnerabilities in their environments that could lead to a successful attack.
Building Attack Scenarios for Analysis
Once an organization has decomposed a current attack to identify the exploited vulnerabilities, they can use this information to build attack scenarios for analysis within their organization. Attack scenarios are hypothetical sequences of events that an attacker might use to exploit a vulnerability in a system.
By building attack scenarios based on the vulnerabilities identified in current attacks, organizations can better understand the risks associated with their systems. Attack scenarios enable organizations to assess the likelihood and impact of an attack that exploits a particular vulnerability and prioritize their efforts to mitigate these risks.
Incorporating Vulnerability Analysis
Incorporating vulnerability analysis into building attack scenarios is essential for ensuring the scenarios are accurate and relevant to the organization. Vulnerability analysis involves identifying and assessing vulnerabilities in a system, and it provides the foundation for building effective attack scenarios.
By combining vulnerability analysis with attack scenarios based on current attacks, organizations can comprehensively understand the risks associated with their systems.
Example
Let’s consider an example to illustrate the importance of combining attack scenarios and vulnerability analysis. Suppose an organization has identified a vulnerability in a web application that allows an attacker to execute arbitrary code on the server. Vulnerability analysis would identify the potential impact of an attack that exploits this vulnerability, such as the theft of sensitive data or the disruption of critical services.
However, vulnerability analysis alone does not explain how an attacker might exploit this vulnerability. On the other hand, attack scenarios can provide insight into the tactics, techniques, and procedures an attacker might use to exploit this vulnerability.
For example, an attack scenario might involve an attacker using a spear phishing email to access a user’s credentials, then using those credentials to access the vulnerable web application. Once the attacker has access to the application, they might use a remote code execution (RCE) exploit to execute arbitrary code on the server.
By combining attack scenarios with vulnerability analysis, the organization can gain a more comprehensive understanding of the risks associated with this vulnerability. This understanding enables the organization to implement effective defenses against potential attacks, such as implementing multi-factor authentication to reduce the likelihood of a successful spear phishing attack and patching the vulnerable web application to mitigate the RCE vulnerability.
Attack scenarios provide an additional layer of analysis that enables organizations to understand the tactics, techniques, and procedures an attacker might use to exploit a vulnerability. By combining attack scenarios with vulnerability analysis, organizations can gain a more comprehensive understanding of the risks associated with their systems and can implement effective defenses against potential attacks. As the threat landscape continues to evolve, using attack scenarios in combination with vulnerability analysis will become increasingly important for organizations to protect themselves against cyber threats.
Putting it all together
Later in this module you will find a section covering resources for developing attack scenarios. There you will find information on attacks organized by threat vector, information on attackers and their targets, and industry specific attack data. Any or all of this information may be used in developing an attack scenario and risk estimate.
For example, if leadership asks about the risk from a recently reported attack you may decide to use the industry specific data along with your current vulnerability data and decompose the tactics of the attack. Link any existing vulnerabilities to the attack tactics. Based on the presence of relevant vulnerabilities, estimate the likelihood an attacker could leverage them against the organization.
Here’s another example: If leadership asks for a generalized estimate of risk you may decide to leverage industry specific data to identify the most likely attacks your organization could expect to experience. Then analyze your vulnerability data matching existing vulnerabilities to the common attack tactics. Then, based on the presence of relevant vulnerabilities, estimate the likelihood an attacker could leverage them against the organization.
And another example: You may decide in your attack scenario to break down the likelihood of success for each stage of the attack. For each stage you would identify the relevant vulnerabilities and estimate the likelihood of compromise. This approach gives a more granular view of which vulnerabilities and stages of the attack result in higher exposure for the organization.
Weighting Factors and Aggregating Ranges
So far, we have discussed fairly straightforward analysis and single factors. When there is a single factor for threat, such as a percentage of your threat landscape that is vulnerable, it is much easier to estimate likelihood. In more complicated situations you may need to consider multiple factors, data other than just vulnerability data. In this case, you will need to know some options for dealing with multiple factors and aggregating risk ranges.
In a more complicated risk analysis, you will need to establish how you combine multiple factors into a single estimate. In Godwin Odu’s “Weighting Methods for Multi-Criteria Decision Making Technique” , September 2019, Journal of Applied Science and Environmental Management he provides a good overview of methods with references from relevant research.
Basic Weighting
Weights for multi-criteria evaluations are often a combination of both qualitative and quantitative. One method is to assign weights to qualitative data using a numerical scale such as 1-9 in which 1 is equal importance and 9 is extreme importance. This author prefers using a 1-5 scale for consistency with the 1-5 scale discussed in module 1.
Remember that weighting is subjective and based on expert opinion or stakeholder preference for priorities. This process can be time-consuming to reach concurrence among all parties involved and will require compromise. However, it is a valuable exercise and builds concurrence early in the process. This highlights the reality that even the most objective measurement inevitably involves some inaccuracy and opinion (whether from the subject matter expert or the stakeholder) plays an often decisive role.
Example: You are considering five factors in developing your risk estimate. After meeting with subject matter experts and stakeholders you come to an agreement that two of the five factors are critically important and the other three factors are secondary. With this in mind the critical factors are weighted by a factor of 2 (this means you multiply the value by 2). Weighting works best when you are dealing with whole number values (1,2,4,20 etc).
Special Weighting
In some cases, you will need to evaluate factors for which the client has special conditions. A special condition is one which automatically generates a designation of a high risk, for example.
Let’s apply special weighting to vulnerability data analysis. If your vulnerability data analysis identifies the existence of known exploitable vulnerabilities or easily exploited code executions this might be deemed to automatically be rated as a high risk without the need for estimating likelihood. In this textbook we provide guidance on evaluating vulnerability data and outline just these types of situations, which is a type of special weighting. In some cases, some things may merit automatic values or decisions.
Let’s apply special weighting to another situation. Imagine that you have scoped your risk analysis to include multiple systems, some of which are critical assets to the organization. This characteristic, being a critical asset, may warrant special weighting. For example, if a critical asset has exploitable vulnerabilities, or vulnerabilities that could lead to initial access and privilege escalation, these might merit special weighting to automatically result in a very high risk rating.
Special weightings can be useful in customizing your analysis to the business goals and risk appetites. While it is useful, it should be used with caution and always with clear explanation, client approval, and transparency.
Qualitative Factors
As you work through your attack scenarios you may need to consider factors that are not easily quantified. Vulnerability data, for example, is easily quantified as it may be used to represent a percentage of your threat landscape. In this instance it is a percentage of the whole landscape. But how do you handle evaluating the risk of a procedure or some factor that doesn’t have an easily identifiable quantity? In these cases, consider using the five-point scale from module 1.
The five-point scale can be used with any set of text labels. For example, to develop an estimate of threat related to a procedure you might ask qualified participants (your subject matter experts) how they would rate the frequency of the procedure being strictly applied or followed. 1 might mean almost never, 2 could mean sometimes, 3 could mean most of the time, 4 could mean consistently, and 5 could mean always without exception.
When we use a 5-point scale we can easily assign 20% ranges to each value. A 5-point scale is preferable as a 3-point scale leads to mid-range bias (people don’t want to assign low or high extremes so everything falls into the mid-range), and more than 5 values becomes confusing (people need to be presented with easy selections to encourage participation).
You can use questionnaires to collect the necessary feedback, and then easily compile all the feedback for analysis and presentation.
Aggregating Risk Ranges
Here are two widely accepted methods of aggregating risk ranges.
- Arithmetic Mean: calculate the average of the lower bounds and the average of the upper bounds. Alternatively take the mid-range value of a three-point range.
- Minimum and Maximum: take the lowest data point of the ranges, and the maximum value of the highest data point. The range is the difference between these two values. This is an all-inclusive range rather. To establish mid-point, you could take the average of the available mid-point values and divide them by the number of ranges (number of available mid-point values).
Always remember that you must explain whatever method you chose in your analysis when reporting results and communicating findings. It is more important that stakeholders understand the methods used then which method is selected, as they all have merit in different situations.
Resources for Developing Attack Scenarios
Verizon DBI Top Attack by Attack Vectors
The annual VERIZON Data Breach Investigation (DBI) Report is another excellent source of information on the state of cyber security and attacks in every industry. It is a good source for developing attack scenarios for analysis. Below are several types of attack that can be analyzed. Each represents an attack vector (point of entry).
Stolen Credentials (Hacking)
Attackers can obtain credentials through various methods, some of which include:
- Phishing: Attackers send fraudulent emails that appear to be from a legitimate source, such as a bank or social media platform, to trick users into providing their login credentials.
- Social engineering: Attackers use social engineering techniques to trick users into revealing their login credentials. This can include impersonating a help desk technician or sending a fake password reset email.
- Password reuse: Many users reuse the same password across multiple accounts. Attackers can obtain credentials from one account and use them to access other accounts.
- Brute force attacks: Attackers use automated tools to try a large number of username and password combinations until they find the correct one.
- Keylogging: Attackers can install malware on a user’s device that records every keystroke, including login credentials.
- Insider threats: Attackers can obtain credentials through insiders with sensitive information access. This can include employees who have been compromised by attackers or employees who intentionally steal credentials.
- Physical theft: Attackers can steal physical devices, such as laptops or mobile phones, which contain login credentials.
Ransomware (Malware)
Ransomware is malicious software that encrypts a victim’s files or locks their computer or device, making it inaccessible to the victim. The attacker then demands a ransom, usually in the form of cryptocurrency, in exchange for providing the decryption key or unlocking the device. Ransomware attacks can be initiated through various means, such as phishing emails, malicious attachments, or exploiting vulnerabilities in software or systems.
The consequences of ransomware attacks can be severe, including data loss, financial loss, and reputational damage. To prevent ransomware attacks, organizations and individuals should keep software and systems up to date, use antivirus software, and back up important data regularly.
Unfortunately, ransomware attacks have become increasingly common and sophisticated in recent years. According to a report, global ransomware damage costs are expected to reach $20 billion by 2021. Individuals and organizations must be aware of the risks associated with ransomware and take proactive measures to protect themselves against potential attacks.
40% of ransomware incidents involve the use of desktop-sharing software, and 35% involve the use of email. There are various tools the threat actor can use once they are inside your network, but locking down your external-facing infrastructure, especially RDP and Emails, can go a long way toward protecting your organization against ransomware. (Verizon 2022 DBIR pg28)
Backdoor C2 (Hacking)
A backdoor C2 (command and control) is a hacking technique that involves creating a hidden entry point into a system that allows an attacker to bypass normal authentication and gain access to the system anytime. The attacker can then use this access to control the system remotely, steal sensitive information, or perform other malicious activities.
Backdoor C2 hacking can be accomplished through various means, such as exploiting vulnerabilities in software or systems, using social engineering techniques to trick users into installing malware or using brute force attacks to guess passwords. Once the attacker gains access to the system, they can set up a backdoor to control the system remotely without being detected.
One of the main dangers of backdoor C2 hacking is that it can go undetected for long periods, allowing the attacker to steal sensitive information or perform other malicious activities without being detected. To prevent backdoor C2 attacks, organizations and individuals should keep software and systems up to date, use strong passwords, and be cautious of suspicious emails or messages. It is also important to use antivirus software and firewalls to detect and block malicious activity.
Web Application (Hacking)
Web application hacking is a cyber-attack that targets web applications to gain unauthorized access to sensitive information or perform other malicious activities. Web applications are software programs that run on web servers and are accessed through web browsers. They are used for various purposes, such as online shopping, banking, and social media.
Web application hacking can be accomplished through various techniques, such as SQL injection, cross-site scripting (XSS), and file inclusion attacks. SQL injection involves inserting malicious code into a web application’s database to gain access to sensitive information. XSS involves injecting malicious code into a web application to steal user data or perform other malicious activities. File inclusion attacks involve exploiting vulnerabilities in a web application, including malicious files that can be used to access sensitive information.
To prevent web application hacking, organizations and individuals should keep software and systems up to date, use strong passwords, and be cautious of suspicious emails or messages. It is also important to use security tools such as firewalls and intrusion detection systems to detect and block malicious activity.
Web application hacking is a serious threat with severe consequences, including data loss, financial loss, and reputational damage. Organizations and individuals must take proactive measures to protect themselves against attacks.
These attacks can leverage stolen credentials or exploit a vulnerability. As of 2022, DBI using stolen credentials accounts for 80%. This highlights the importance of proper password protection.
Email/Phishing/Pretexting (Social and Malware)
The human element continues to be a key driver of 82% of breaches, and this pattern captures a large percentage of those breaches. Additionally, malware and stolen credentials provide a great second step after a social attack gets the actor in the door, emphasizing the importance of a strong security awareness program. (Verizon 2022 DBIR pg33)
Pretexting is a social engineering attack where an attacker creates a false scenario or pretext to trick a victim into giving up sensitive information. The attacker may pretend to be someone else, such as a bank representative or IT support technician, and use this false identity to gain the victim’s trust and persuade them to reveal confidential information.
On the other hand, phishing is a cyber-attack where an attacker sends fraudulent emails or messages to trick victims into clicking on a malicious link or downloading an infected attachment. The goal of phishing is to steal sensitive information such as login credentials or financial information.
The main difference between pretexting and phishing is that pretexting involves manipulating the victim through a false scenario or pretext. In contrast, phishing involves tricking the victim through a fraudulent email or message. Both tactics rely on social engineering to deceive the victim, but the methods used to achieve this deception differ.
Partner (Malware)
Partner malware, also known as supply chain attacks, is a cyber-attack that targets the software supply chain to gain unauthorized access to systems and data. In a partner malware attack, an attacker targets a third-party vendor or supplier that provides software or services to the target organization. The attacker injects malicious code into the software or service distributed to the target organization.
Partner malware attacks can be difficult to detect because the malicious code is hidden within legitimate software or services. Once the software or service is installed or activated, the attacker can access sensitive information or systems and perform other malicious activities.
Organizations should take steps to prevent partner malware attacks, such as vetting third-party vendors and suppliers, monitoring software and services for suspicious activity, and using security tools such as firewalls and intrusion detection systems. It is also important to keep software and systems up-to-date and to use strong passwords to protect against potential attacks.
Partner malware attacks can have severe consequences, including data loss, financial loss, and reputational damage. Organizations need to take proactive measures to protect themselves against potential attacks.
Software Update (Malware)
The SolarWinds attack was a sophisticated cyber-attack that was discovered in December 2020. The attack involved hackers compromising the software supply chain of SolarWinds, a leading IT management software company, and inserting malware into its Orion product [1]. The malware, dubbed “Sunburst,” was designed to evade detection and allowed the attackers to gain access to the networks of SolarWinds’ customers, including US government agencies and private companies [1][2]. The attack is believed to be the work of a Russian state-sponsored hacking group [1]. The SolarWinds attack has been described as one of the most significant cyber-attacks in history, with far-reaching implications for global cybersecurity [2].
Sources:
1https://www.techtarget.com/whatis/feature/SolarWinds-hack-explained-Everything-you-need-to-know
2https://www.npr.org/2021/04/16/985439655/a-worst-nightmare-cyberattack-the-untold-story-of-the-solarwinds-hack
Desktop Sharing Software (RDP)
Desktop Sharing Software, also known as Remote Desktop Protocol (RDP), allows users to remotely access and control a computer or device from another location. Businesses and individuals commonly use RDP to remotely access their computers or servers from a different location, such as from home or while traveling.
RDP allows users to connect to a remote computer or device over the internet or a network. The user can then control the remote computer as if sitting in front of it, using a keyboard, mouse, and other peripherals. RDP can perform various tasks, such as accessing files and applications, troubleshooting issues, and performing software updates.
While RDP can be a convenient tool for remote access, it can also pose security risks if not used properly. Attackers can attempt to exploit vulnerabilities in RDP to gain unauthorized access to systems and data. To mitigate these risks, users should ensure that RDP is only enabled when necessary and configured securely with strong passwords and other security measures.
In addition to taking these steps, users should be cautious of phishing attacks and other social engineering tactics that may trick them into giving away their RDP credentials. By staying vigilant and taking proactive measures to protect against potential attacks, users can help to ensure that their systems and data remain secure when using RDP.
Threat Actors and Targets
Several types of threat actors pose a risk to organizations, including nation-state actors, cybercriminals, hacktivists, and insiders.
Nation-state actors are typically well-funded and highly skilled, and they often target government agencies, military organizations, and companies in strategic industries such as energy, finance, and technology. Nation-state actors usually aim to steal sensitive information or disrupt critical infrastructure.
Cybercriminals are motivated by financial gain and often target businesses and individuals with valuable data or assets. They may use a variety of tactics, such as phishing attacks, ransomware, and social engineering, to gain access to systems and data.
Hacktivists are motivated by political or social causes and may target organizations they perceive as unethical or unjust. They may use tactics such as distributed denial-of-service (DDoS) attacks or website defacement to disrupt the operations of their targets.
Insiders, including employees and contractors, can pose a significant threat to organizations by intentionally or unintentionally exposing sensitive data or systems to risk. Insiders may be motivated by financial gain, revenge, or other personal reasons.
The most frequently targeted types of organizations include those in the healthcare, finance, and retail industries, which often store large amounts of sensitive data. Small and medium-sized businesses are also frequently targeted, as they may have less robust security measures than larger organizations.
- Server (Web & Mail)
- Desktop/Laptop
- Database
- Finance (Person)
- Documents (Media)
- Network
- Kiosk/Terminal
- Embedded
Verizon DBI Report Data and Definitions
Verizon provides the following definitions of incident and data breach:
Incident: A security event that compromises the integrity, confidentiality or availability of an information asset.
Breach: An incident that results in the confirmed disclosure—not just potential exposure—of data to an unauthorized party. A Distributed Denial of Service (DDoS) attack, for instance, is most often an incident rather than a breach since no data is exfiltrated.
NOTE: The definition of breach does not indicate whether the unauthorized party is internal or external to the organization.
Below are some of the highlights of the most common way to use this report in your risk analysis and for developing attack scenarios.
Incident Frequency: The industry data establishes a ratio you can use as a factor in estimating the percentage of incidents your organization might experience as data breaches. For example, the Food Service industry experienced 68 of 254 incidents as confirmed data disclosures. Stated another way, that’s 68/254 or a likelihood of 26.7% (.267) that an incident might result in data disclosure. So, if you want to estimate what percentage of incidents our organization experiences might result in a breach, we could multiple .267 x #organizational incidents = estimated # breaches.
Top Patterns: The top pattern data provides a percentage of breaches that are among these top patterns. It would be unusual, for example, to expect your organization would experience some other type of attack with greater frequency. For example, the Food Service industry saw 90% of breaches were from system intrusions, web application attacks and social engineering. Using our estimate from incident frequency we could derive the % of our organizations incidents that would not only result in a breach, but a good indication of potential sources or patterns.
Threat Actors: This information helps inform your attack scenarios by identifying the most likely threat actors.
Motivations: This information helps inform your attack scenarios with realistic motivations help you to select appropriate targets of your scenarios.
Data Compromised: This information helps you make your attack scenarios more realistic by focusing on the targeted data.
Verizon DBI Data by Industry
The following tables have been populated from the Verizon DBI 2023. When developing attack scenarios consider the top patterns, threat actors, motivations and data compromise. You can also use the incident frequency data to establish an initial estimate. Always be sure to explain where you’ve obtained public data and how you’ve used it in your analysis.
Food Services
|
Incident Frequency |
Top Patterns |
Threat Actors |
Motivations |
Data Compromised |
|
254 incidents, 68 with confirmed data disclosure |
System Intrusion, Basic Web Application Attacks and Social Engineering represent 90% of breaches |
External (93%), Internal (9%), Multiple (1%)
|
Financial (100%) |
Payment (41%), Credentials (38%), Personal (34%), Other (26%)
|
Table 2 Food Services Statistics
Education Services
|
Incident Frequency |
Top Patterns |
Threat Actors |
Motivations |
Data Compromised |
|
497 incidents, 238 with confirmed data disclosure |
System Intrusion, Miscellaneous Errors and Social Engineering represent 76% of breaches |
External (72%), Internal (29%), Multiple (1%), Partner (1%) |
Financial (92%), Espionage (8%), Convenience (1%), Fun (1%) |
Personal (56%), Credentials (40%), Other (25%), Internal (20%) |
Table 3 Education Services Statistics
Financial and Insurance
|
Incident Frequency |
Top Patterns |
Threat Actors |
Motivations |
Data Compromised |
|
1,832 incidents, 480 with confirmed data disclosure |
Basic Web Application Attacks, Miscellaneous Errors and System Intrusion represent 77% of breaches |
External (66%), Internal (34%), Multiple (1%) |
Financial (97%), Espionage (3%), Convenience (1%), Ideology (1%) |
Personal (74%), Credentials (38%), Other (30%), Bank (21%) |
Table 4 Financial Insurance Statistics
Healthcare
|
Incident Frequency |
Top Patterns |
Threat Actors |
Motivations |
Data Compromised |
|
525 incidents, 436 with confirmed data disclosure |
System Intrusion, Basic Web Application Attacks and Miscellaneous Errors represent 68% of breaches |
External (66%), Internal (35%), Multiple (2%) |
Financial (98%), Espionage (2%), Fun (1%), Ideology (1%) |
Personal (67%), Medical (54%), Credentials (36%), Other (17%) |
Information
|
Incident Frequency |
Top Patterns |
Threat Actors |
Motivations |
Data Compromised |
||
|
2,110 incidents, 384 with confirmed data disclosure |
System Intrusion, Basic Web Application Attacks and Social Engineering represent 77% of breaches |
External (81%), Internal (20%), Multiple (2%), Partner (1%) |
Financial (92%), Espionage (8%) |
Personal (51%), Credentials (37%), Other (35%), Internal (19%) |
||
Table 6 Information Industry Statistics
Manufacturing
|
Incident Frequency |
Top Patterns |
Threat Actors |
Motivations |
Data Compromised |
|
1,817 incidents, 262 with confirmed data disclosure |
System Intrusion, Social Engineering and Basic Web Application Attacks represent 83% of breaches |
External (90%), Internal (11%), Multiple (2%), Partner (1%) |
Financial (96%), Espionage (4%), Convenience (1%) |
Personal (60%), Credentials (38%), Other (37%), Internal (18%) |
Table 7 Manufacturing Industry Statistics
Mining, Oil & Gas
|
Incident Frequency |
Top Patterns |
Threat Actors |
Motivations |
Data Compromised |
|
143 incidents, 47 with confirmed data disclosure |
System Intrusion, Basic Web Application Attacks and Miscellaneous Errors represent 81% of breaches |
External (80%), Internal (20%) |
Financial (63%–93%), Espionage (4%–32%), Grudge (1%–21%), Ideology (0%–15%), Convenience/Fear/ Fun/Other/ Secondary (0%–7% each) |
Personal (50%), Internal (33%), Other (26%), Credentials (24%) |
Table 8 Mining, Oil & Gas Statistics
Professional & Technical Services
|
Incident Frequency |
Top Patterns |
Threat Actors |
Motivations |
Data Compromised |
|
1,398 incidents, 423 with confirmed data disclosure |
System Intrusion, Basic Web Application Attacks and Social Engineering represent 90% of breaches |
External (92%), Internal (9%), Multiple (3%), Partner (2%) |
Financial (96%), Espionage (4%), Convenience (1%) |
Personal (57%), Credentials (53%), Other (25%), Internal (16%) |
Table 9 Professional & Technical Services Statistics
Public Administration
|
Incident Frequency |
Top Patterns |
Threat Actors |
Motivations |
Data Compromised |
|
3,273 incidents, 584 with confirmed data disclosure |
System Intrusion, Lost and Stolen Assets, and Social Engineering represent 76% of breaches |
External (85%), Internal (30%), Multiple (16%) |
Financial (68%), Espionage (30%), Ideology (2%) |
Personal (38%), Other (35%), Credentials (33%), Internal (32%) |
Table 10 Public Administration Statistics
Retail
|
Incident Frequency |
Top Patterns |
Threat Actors |
Motivations |
Data Compromised |
|
406 incidents, 193 with confirmed data disclosure |
System Intrusion, Social Engineering, and Basic Web Application Attacks represent 88% of breaches |
External (94%), Internal (7%), Multiple (2%), Partner (2%) |
Financial (100%), Espionage (1%) |
Payment (37%), Credentials (35%), Other (32%), Personal (23%) |
Table 11 Retail Industry Statistics
Open Web Application Security Project (OWASP)
The Open Web Application Security Project (OWASP) is a non-profit organization that aims to improve the security of software applications. It provides free and open resources, tools, and guidelines for developers, security professionals, and organizations to build and maintain secure applications. In this article, we will discuss what OWASP is, how it works, and its benefits.
OWASP provides a wide range of resources and tools for application security. Its flagship project is the OWASP Top Ten, a list of the most critical security risks to web applications. The OWASP Top Ten is updated every three years to reflect changes in the threat landscape. It provides developers and security professionals with a framework to prioritize their security efforts.
OWASP’s resources and tools are free and open to everyone. They are developed and maintained by a community of volunteers who contribute their time and expertise to improve application security. This open and collaborative approach ensures that OWASP’s resources are up-to-date, relevant, and accessible to everyone.
One of the best-known OWASP projects is the Top Ten Web Application Security Risks.
As a repository of application vulnerabilities, OWASP is an excellent source to use for developing attack scenarios for analysis.
Additional Cyber Statistics Resources
The following websites are suggested reading and trusted sources for statistical data related to cyber-attacks.
FBI 2023 IC3 report
https://www.ic3.gov/Media/PDF/AnnualReport/2023_IC3Report.pdf
Insurance Information Institute
https://www.iii.org/fact-statistic/facts-statistics-identity-theft-and-cybercrime
Small business cyber statistics
Firewall Times
https://firewalltimes.com/small-business-cybersecurity-statistics/
IBM Data-Breach Report
https://www.ibm.com/reports/data-breach
Report: https://www.ibm.com/downloads/cas/E3G5JMBP
Sources like these can provide useful statics such as this one: Among companies with fewer than 500 employees, the average cost of a data breach is approximately $3.31 million per incident. That averages (2023) to $165 per breached record.
