
1. Plan to Conduct Self-Administered Surveys
1.3 Surveys conducted with a population or a sample
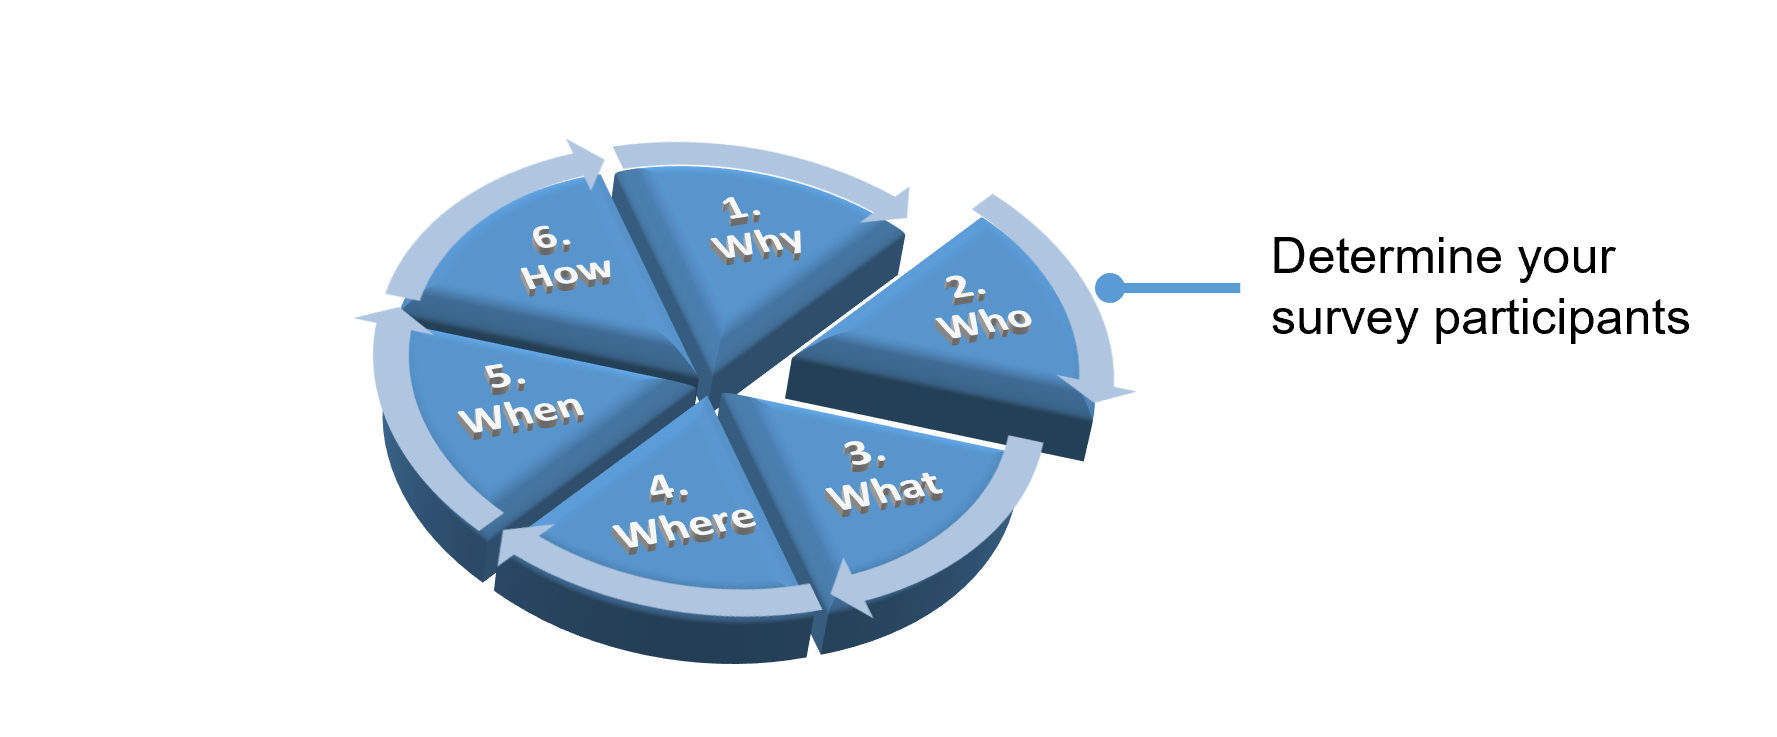
Determining a clear reason and purpose for conducting surveys is an essential first step (the Why). Next, you need to identify whom you will survey and decide whether you will survey the entire population or just a sample. This second step—the Who—plays a critical role in effective survey design and data analysis (see Figure 3).
Figure 3 The Who Step in the Survey Design and Data Collection Process
You conduct a survey with people who you believe have the information you need. These individuals might be employees, customers, or other relevant stakeholders. But, how many of them actually have the information you are looking for? That group is your population.
If the population is small, you can survey every member of the population. However, if the population is large, you must decide whether to survey the entire group or just a sample. This decision also affects how you will analyze the data—using descriptive statistics, inferential statistics, or both (King & Minimum, 2008[1]).
A population is the entire group of people whose characteristics you want to understand.
A sample is a subset of the population that you decide to study when it is impractical or too costly to study the entire group.
So, start by identifying the population that you wish to study. Ask yourself the following key questions:
- Who are the people I want to describe or explain with the data I collect?
- Who are the people I do not intend to describe with this data?
Below are some examples:
Examples
- If you want to learn about the general characteristics of the U.S. population, you might refer to data from the U.S. Census Bureau. However, such data usually won’t answer specific questions such as whether a new incentive plan will affect employee performance. As an L&D, HRD, OD, or PI professional, you likely don’t need to study a national population anyway. Instead, your target populations are usually much smaller groups such as employees in a specific department in your organization, the entire staff of your organization, or members of the local community.
- If you are studying job satisfaction among a few dozen members of your sales department, then those employees represent your population and that’s a small one. Employees in other departments fall outside your population, as you aren’t seeking to describe them.
- Similarly, if you’re interested in understanding how U.S. Coast Guard cadets perceive leadership effectiveness, then they are your population. Cadets in the U.S. Navy or Army are not included.
Next, determine whether it’s feasible and necessary to survey with the entire population or or if you should use a sample instead.
- If your population is small, you can survey everyone—no sampling needed. For example, when conducting a climate or employee engagement survey in a small organization, it may be practical and even beneficial to survey all employees of the organization. If your survey collects quantitative data, you may be able to analyze results quickly even with a large number of responses , unlike qualitative data which takes more time to process.
- However, if your population is large—for instance, training and performance improvement professionals across the U.S.—surveying everyone may not be practical. In this case, you would select a sample from the population and use the results to make inferences about the population (as illustrated in Figure 4).
Figure 4 Sample Results Are Used to Infer the Population Results
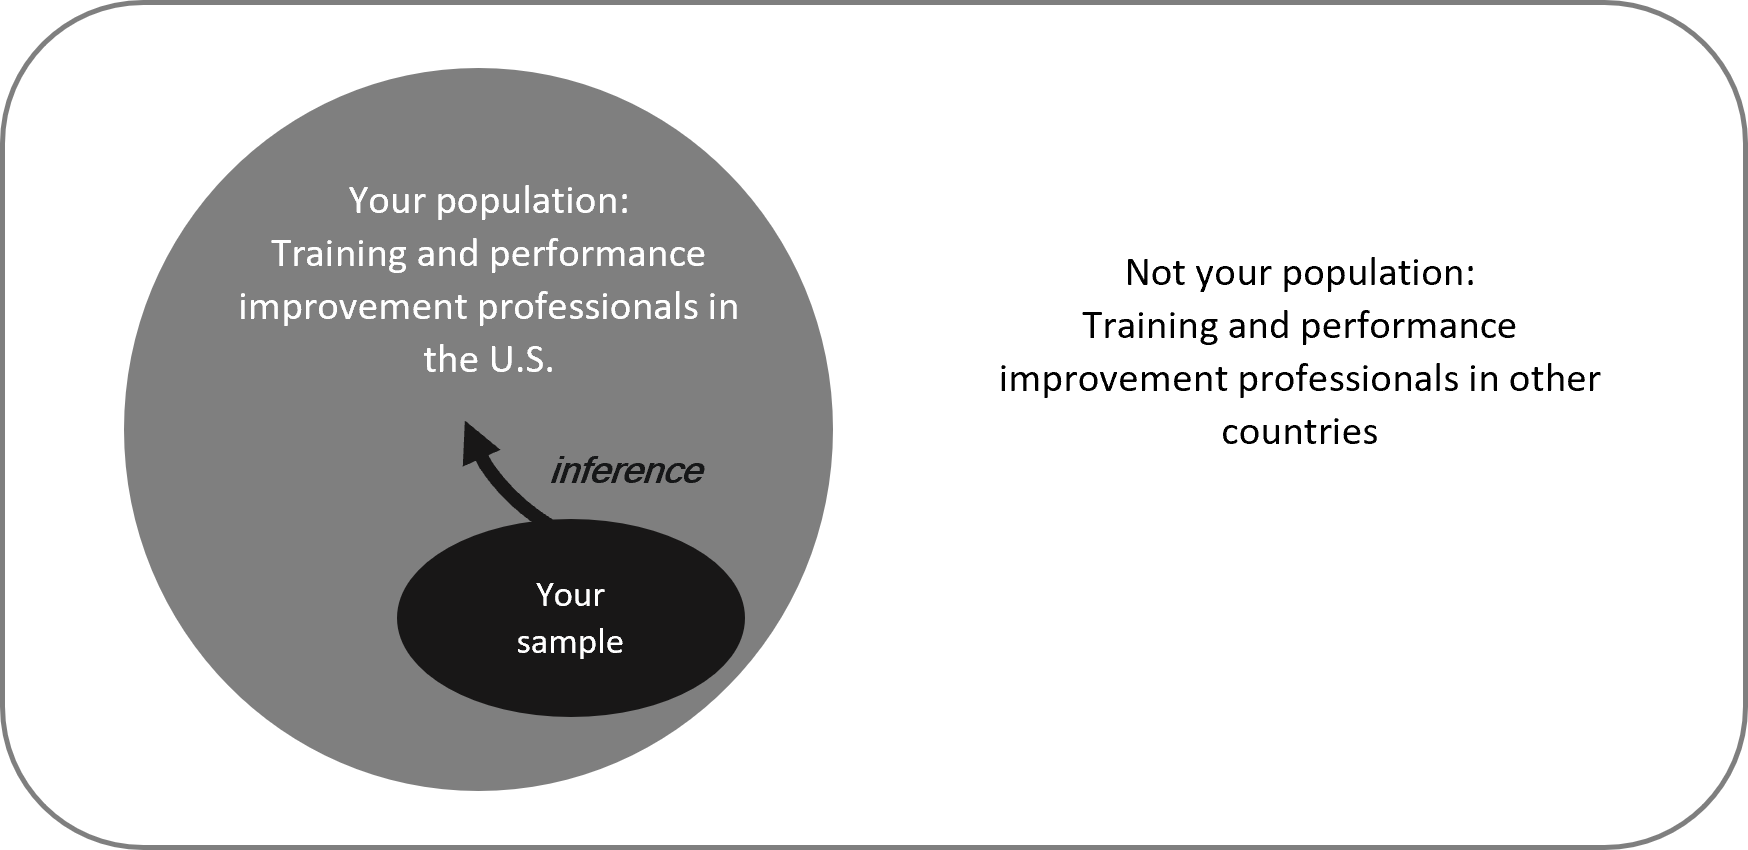
When you randomly select a sample from the population, it has a higher likelihood of accurately representing the population. You can then apply inferential statistics to analyze your data and draw conclusions about the population based on sample results. Inferential statistics include methods such as t-tests (see Appendix A for more details).
By contrast, descriptive statistics are used to summarize or describe the characteristics of either a population or a sample. These include measurements such as mean, mode, median, standard deviation, frequency, and percentage.
In survey-based studies, you may use both descriptive and inferential statistics.
Examples
Suppose your organization has 3,000 employees (that’s your population).
- If you survey a random sample of 250 employees, you may use descriptive statistics to report the sample’s mean scores and standard deviations.
- You can then use inferential statistics, such as a t-test, to test your research hypothesis and infer results about the entire 3,000 employee population.
- King, B. M., & Minium, E. W. (2008). Statistical reasoning for the behavioral sciences (5th ed.). John Wiley & Sons. ↵
