
1. Plan to Conduct Self-Administered Surveys
1.4 Sampling methods
If you decide to survey a sample and use inferential statistics to generalize findings to the entire population, you need to select an appropriate sampling method. Researchers have developed several sampling strategies to ensure that the sample accurately represents the population (Fraenkel & Wallen, 1990[1]). For example, let’s return to the earlier scenario: You want to select a sample of 250 employees from a population of 3,000 employees. The method you choose for selecting those 250 employees will influence the quality and generalizability of your survey results.
1.4.1 Simple random sampling
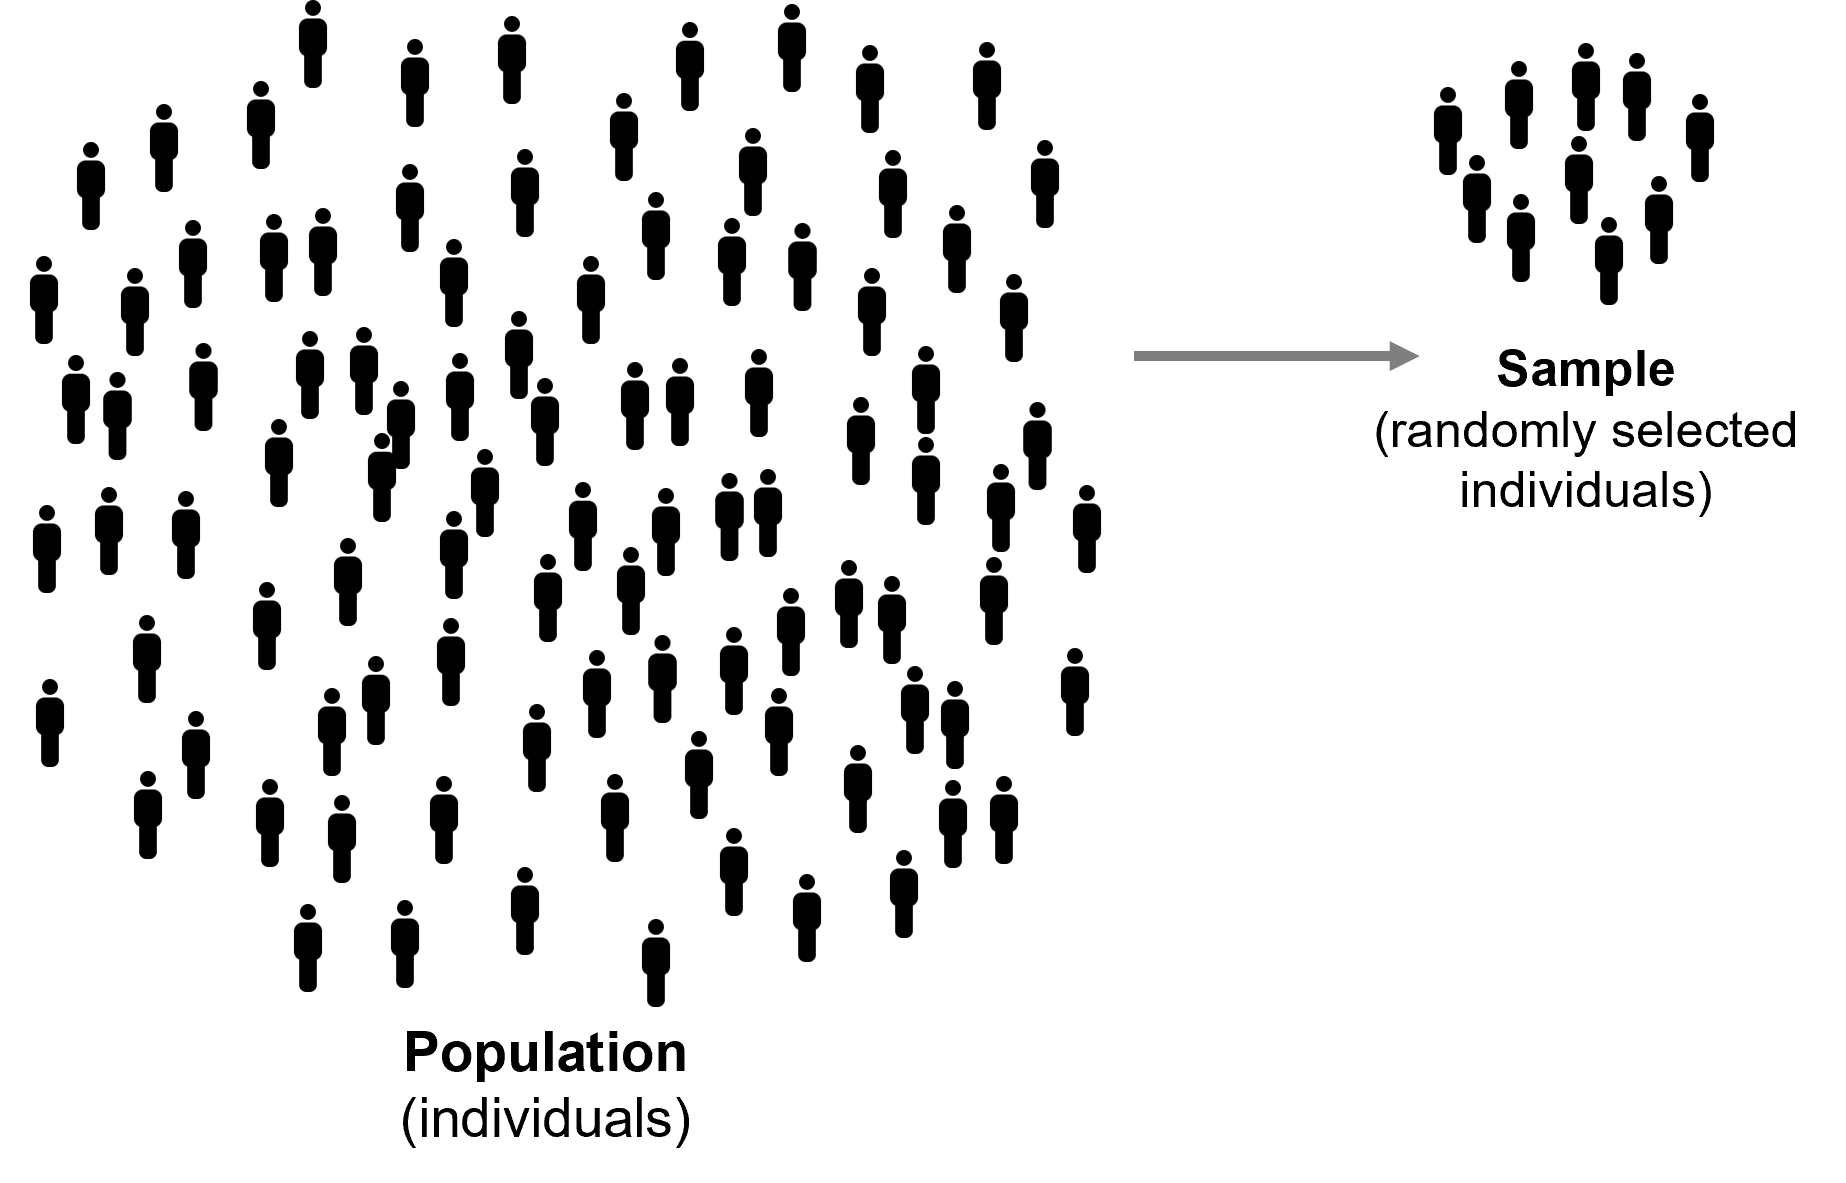
With simple random sampling, you randomly select individuals from the entire population. This method increases the change that the sample characteristics are similar to those of its population. For example, a group of 250 employees selected from a population of 3,000 employees would likely reflect the overall demographics, experiences, or opinions of the entire employee(Figure 5).
Figure 5 Illustrating Simple Random Sampling
To carry out simple random sampling using Microsoft Excel, assign a unique ID number from 1 to 3,000 to all 3,000 employees. Next, use the =RANDBETWEEN(1,3000) function to generate 250 random numbers. Then, select 250 employees whose ID numbers match the randomly generated numbers.
Alternatively, you may use Excel’s Sampling function from the Data Analysis Toolpak. First, you may need to activate the Data Analysis menu in Excel. In Excel,
- Click the File tab, and click Options.
- Click Add-Ins, and then in the Manage box, select Excel Add-ins.
- Click Go.
- In the Add-Ins available box, select the Analysis ToolPak checkbox, and click OK.
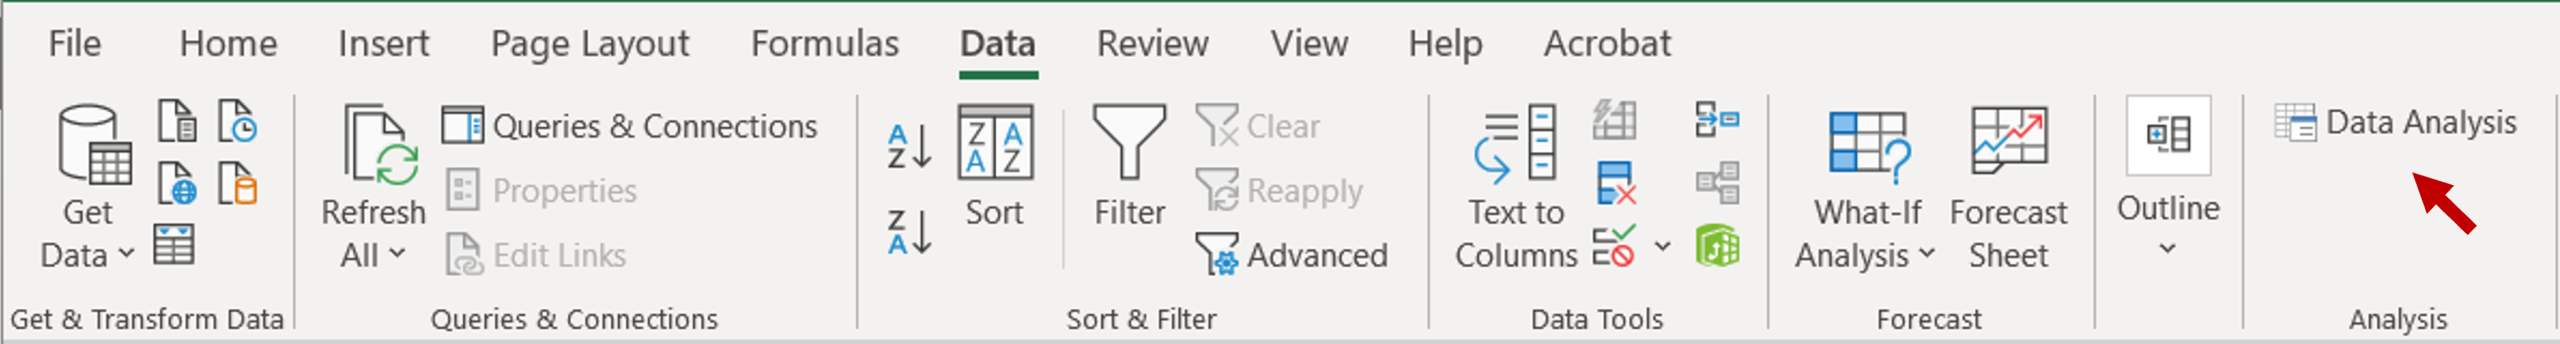
- After successfully loading the Analysis ToolPak, the Data Analysis tool appears in the Analysis group on the Data tab (Figure 6).
Figure 6 Data Analysis Under the Data Tab
To randomly select 250 employee IDs from 3,000 IDs,
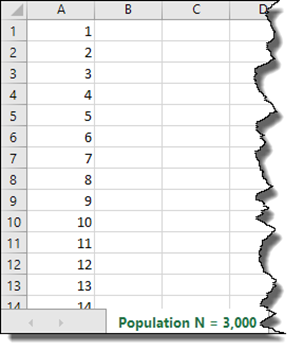
- Open an Excel file that contains 3,000 Employee IDs in a column. You may use Ch1.4-SamplingData.xlsx for practice (Figure 7).
Figure 7 An Excel File Containing Population Members’ IDs
- Select Data > Data Analysis from the menu.
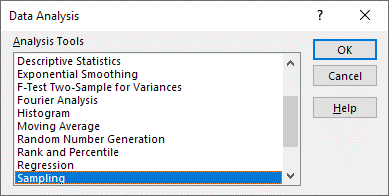
- Select Sampling and click OK (Figure 8).
Figure 8 Selecting Sampling in the Data Analysis Window
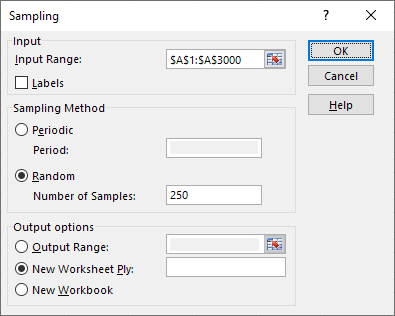
- In the Input Range field, enter $A$1:$A$3000 (or select from A1 to A3000). Click Random, enter 250 in the Number of Samples field, and click OK (Figure 9).
Figure 9 Entering Input in the Sampling Window
- In a new worksheet, a randomly selected 250 IDs will be presented. You may sort the numbers in the column from smallest to largest.
1.4.2 Stratified random sampling
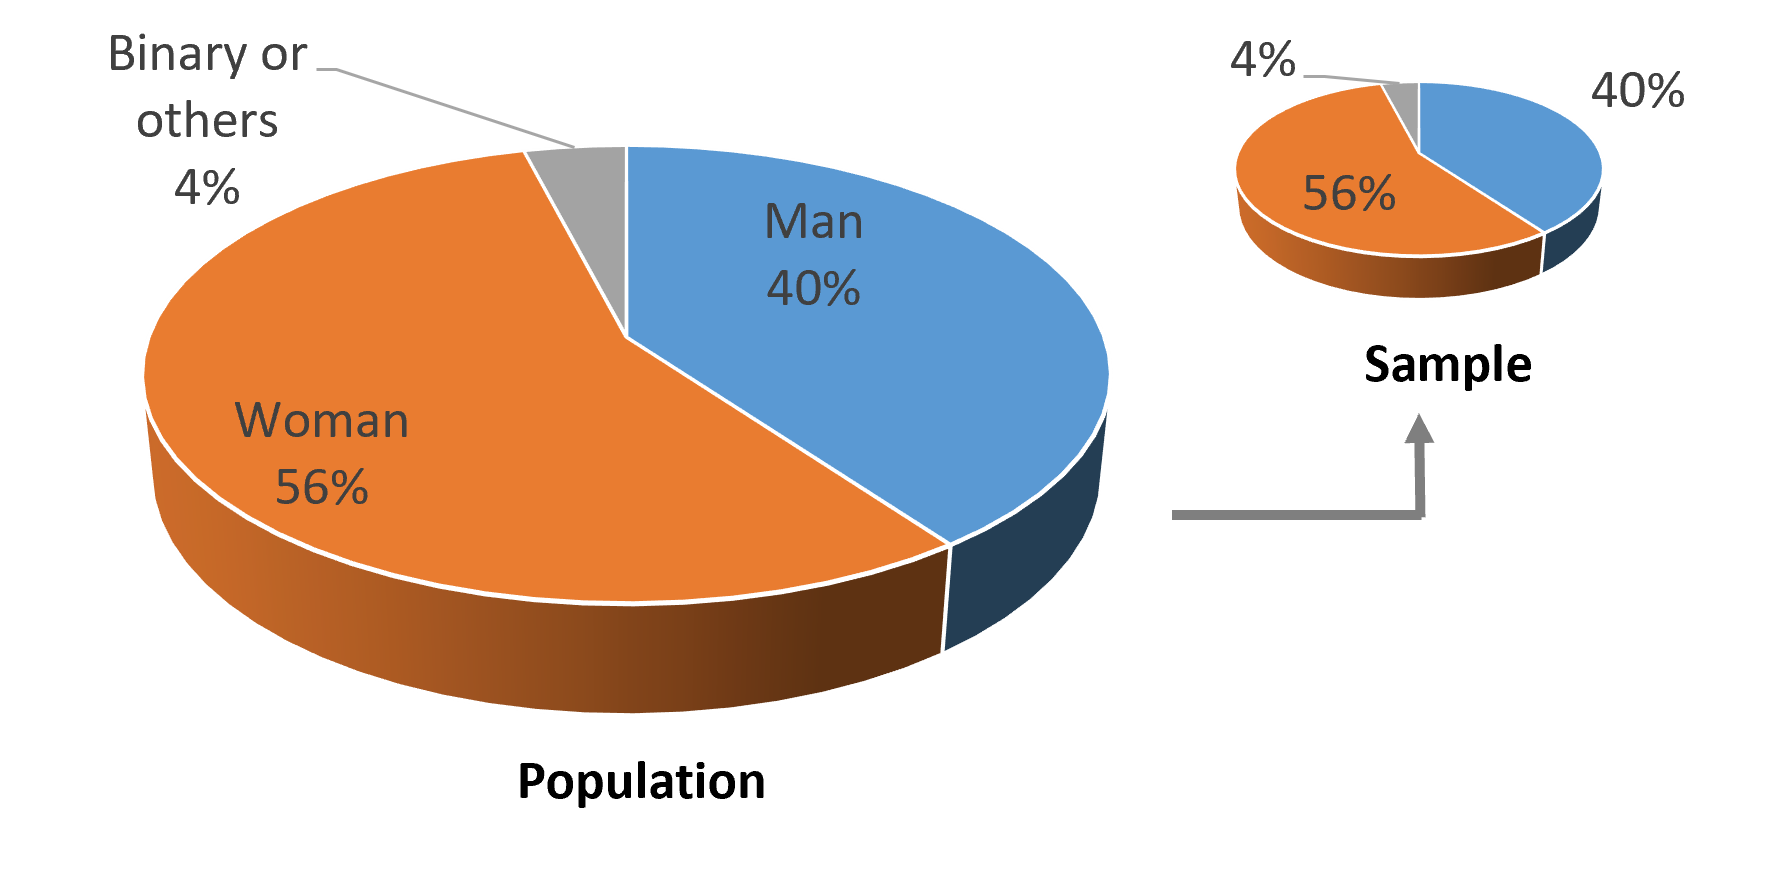
Use stratified random sampling when you want your sample to reflect the same proportions of specific subgroups (e.g., gender, department, branch) as in the overall population. For example, suppose your population of 3,000 employees includes 40% of employees who identify as men, 56% as women, and 4% as nonbinary or another gender identity. To maintain that same proportion in a sample of 250, you would randomly select 100 employees (40% of 250) who identify as men, 140 employees (56% of 250) who identify as women, and 10 employees (4% of 250) who identify as nonbinary or another gender identity (Figure 10).
Figure 10 Illustrating Stratified Random Sampling
1.4.3 Cluster random sampling
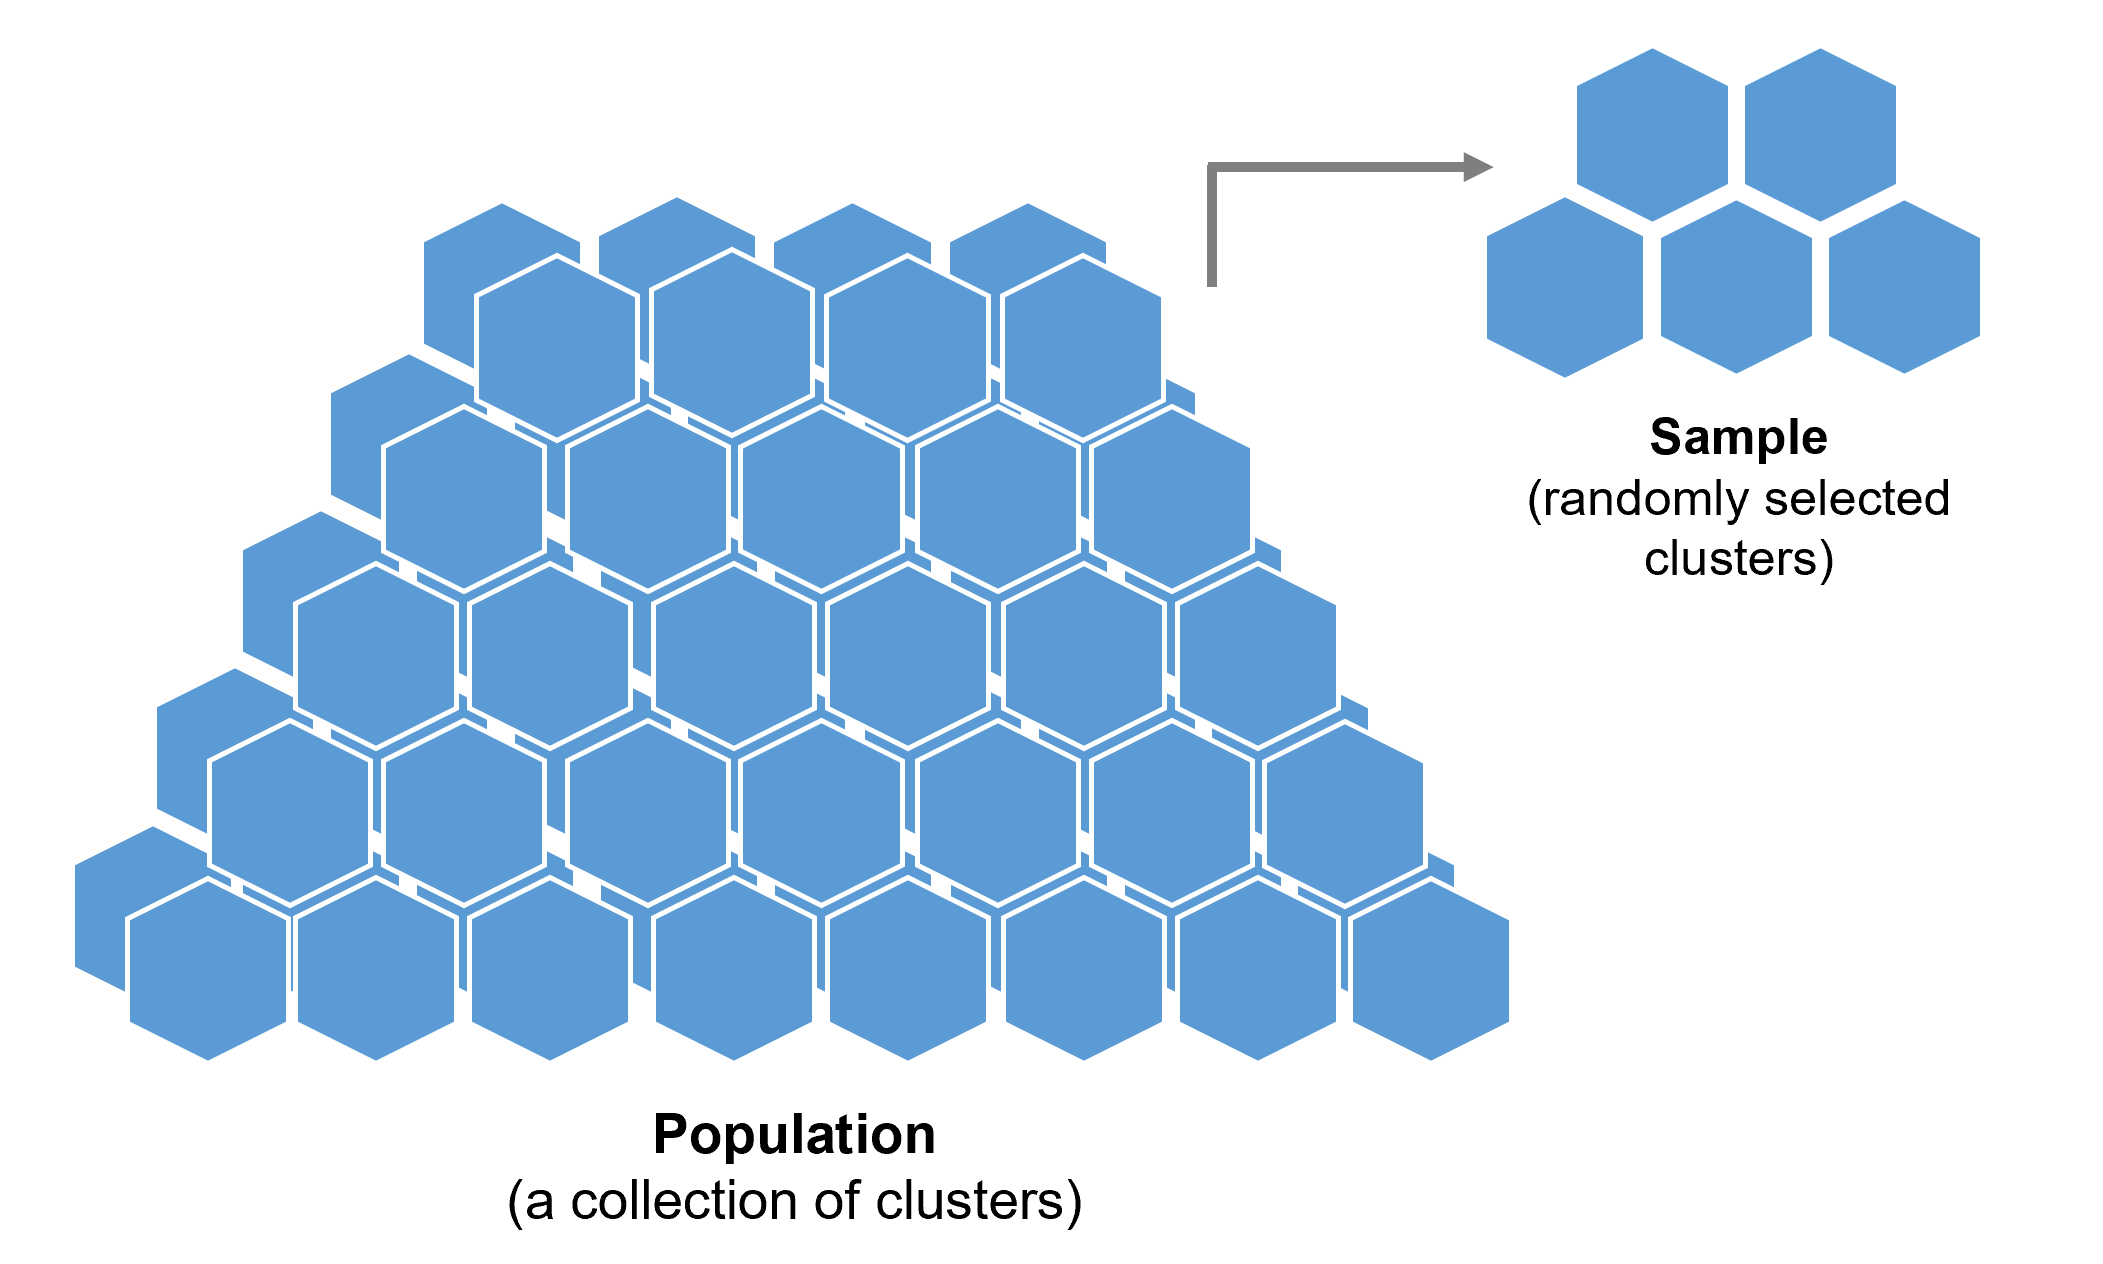
Let’s say, your organization has 3,000 employees distributed across 60 branches, with each branch considered a cluster. On average, each branch (cluster) has approximately 50 employees. Instead of randomly selecting individuals from the entire 3,000 employee pool, you can randomly select five branches (clusters) as illustrated in Figure 11 (i.e., 5 random branches x approx. 50 employees at each branch = approx. 250 employees). However, this method may not work well for selecting a sample of 250 employees if the number of employees per branch varies significantly. In that case, you can first perform cluster random sampling to select branches, and then apply simple random sampling or stratified random sampling within each selected cluster to ensure a more accurate and representative sample.
Figure 11 Illustrating Cluster Random Sampling
1.4.4 Systematic sampling
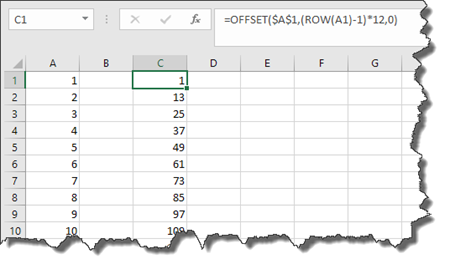
With systematic sampling, you select every nth individual from a list—in this case, every 12th employee from a coded list of 3,000 employees. To do this in Excel:
- Assign a unique ID to each employee in Column A, from 1 to 3,000.
- In cell C1, enter the following formula: =OFFSET($A$1,(ROW(A1)-1)*12,0)
- Copy this formula down for 250 rows in Column C.
This will return the ID of every 12th employee from the list, giving you a systematic sample of 250 employees (Figure 12).
Figure 12 Selecting Every 12th ID in Excel
1.4.5 Convenience sampling
With convenience sampling, you select participants who are easy to access or willing to participate. For example, you might survey 250 employees from a couple of departments where you have strong working relationships and support for your survey study. This is the least rigorous sampling method because the sample may be biased and not representative of the large population. As a result, findings based on convenience samples should be interpreted with caution, especially when generalizing to the full population.
To determine a sample size based on the population size, confidence level, and margin of error, you may use a sample size calculator freely available on the web such as: SurveyMonkey’s sample size calculator.
- Fraenkel, J. R., & Wallen, N. E. (1990). How to design and evaluate research in education. McGraw-Hill. ↵
