3. Explore Various Rating Scales
3.1 Discrete vs. continuous rating scales
Rating scales can be categorized based on whether they produce discrete or continuous data.
Discrete rating scales offer a limited set of fixed response options. Examples include the Likert scale and other Likert-type scales, as shown below. When using these verbal descriptor rating scales, respondents select one of the predefined options, yielding discrete data. The recorded data can be summarized using frequencies or percentages. Or, numerical values can be assigned to the options to calculate average scores.
| Example 1 | Example 2 | Example 3 |
|---|---|---|
| ○ Very untrue (%)
○ Somewhat untrue (%) ○ Somewhat true (%) ○ Very true (%) |
○ Strongly disagree (%) (1)
○ Disagree (%) (2) ○ Neutral (%) (3) ○ Agree (%) (4) ○ Strongly agree (%) (5) |
○ Terrible (1)
○ Poor (2) ○ Mediocre (3) ○ Fair (4) ○ Good (5) ○ Very good (6) ○ Excellent (7) |
A partially-labeled Likert scale still generates discrete data:
Strongly disagree 1 2 3 4 5 Strongly agree
Similarly, the following partially-labeled rating scales (a.k.a. semantic differential) also produce discrete data:
The workshop was:
Boring 1 2 3 4 5 Interesting
Irrelevant 1 2 3 4 5 Relevant
Unhelpful 1 2 3 4 5 Helpful
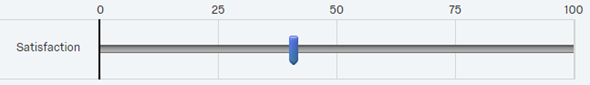
Continuous rating scales allow measurement on a continuum, capturing both whole numbers (e.g., 1, 2, 3) and fractional values (e.g., 1.2, 3.324, 114.59). To collect this type of data, the scale must let respondents select any point along the continuum.
A common example is a web-based slider, which can be configured to record values with multiple decimal places. For instance, if you use a slider to measure satisfaction from 0 to 100, a respondent might place the bar at 40.95, reflecting a precise level of response.