
3. Explore Various Rating Scales
3.4 Graphic rating scales and Web-based sliders
Graphic rating scales were developed in the early 20th century as a method for performance appraisal. These scales typically consist of several simple descriptive terms arranged on a horizontal line, representing different levels of a particular trait (Freyd, 1923[1]). Graphic rating scales were originally designed as continuous rating tools, allowing respondents to place a checkmark at any point on the line to indicate their rating level. Then, the distance from one edge to the marked point was measured with a stencil. It can be time-consuming to use graphic rating scales in paper questionnaires and manually record the data.
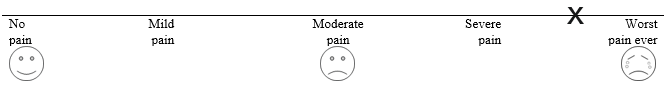
Today, graphic rating scales are not commonly used. However, you can consider a pain-measuring numerical rating scale presented as a graphic rating scale, where patients are asked to mark their pain level with an ‘X’ (Figure 14).
Figure 14 A Graphic Rating Scale Designed to Measure Pain Levels
When using Web-based survey systems, some of the scales previously described can be easily converted to sliders. Sliders are typically designed as continuous rating scales, allowing respondents to select any value within a defined range. For example, on a continuous rating scale from 0 to 10, respondents might select 3.0, 4.2, or 8.1. However, sliders can also be configured to “snap to grid,” limiting responses to specific intervals. That is, the slider shown in Figure 15 with a range from 0 to 10 would function as an 11-point discrete scale, offering only 11 different values to choose from. Thus, you should be aware that sliders with the appearance of a continuous rating scale may produce discrete data (Chyung, Swanson, Roberts, & Hankinson, 2018[2]). Sliders can also be designed with engaging visuals such as stars, gauges, or thermostats (Figure 16).
Figure 15 A Numerical Rating Scale on a Web-Based Slider Provided in Qualtrics

Figure 16 Graphic Sliders Available in Qualtrics

- Freyd, M. (1923). The graphic rating scale. Journal of Educational Psychology, 14, 83-102. ↵
- Chyung, S. Y., Swanson, I., Roberts, K., & Hankinson, A. (2018). Evidence-based survey design: The use of continuous rating scales in surveys. Performance Improvement Journal, 57(5), 38-48. ↵
