
4. Design Surveys Using Evidence-Based Principles
4.2 Rating scales with or without a midpoint
When using bipolar verbal descriptor scales such as the Likert scale or Likert-type scales, you have to decide whether to include or exclude a midpoint. Commonly used midpoints are “Neutral” and “Neither [positive] nor [negated].”
When should you include a midpoint, and when should you exclude it? What impact would this decision have on your data? Answering these questions requires a solid understanding of the odd- and even-numbered rating scales, the type of data they produce—ordinal or interval—and how respondents might use or misuse a midpoint.
4.2.1 Odd-numbered scales vs. even-numbered scales
A bipolar rating scale with a midpoint is an odd-numbered scale (e.g., a 5- or 7-point scale).
○ Strongly disagree (1)
○ Disagree (2)
○ Neutral (3)
○ Agree (4)
○ Strongly agree (5)
○ Strongly dissatisfied (1)
○ Moderately dissatisfied (2)
○ Slightly dissatisfied (3)
○ Neither dissatisfied nor satisfied (4)
○ Slightly satisfied (5)
○ Moderately satisfied (6)
○ Strongly satisfied (7)
A bipolar rating scale without a midpoint is an even-numbered scale (e.g., a 4- or 6-point scale).
○ Strongly disagree (1)
○ Disagree (2)
○ Agree (3)
○ Strongly agree (4)
○ Strongly dissatisfied (1)
○ Moderately dissatisfied (2)
○ Slightly dissatisfied (3)
○ Slightly satisfied (4)
○ Moderately satisfied (5)
○ Strongly satisfied (6)
Whether odd- or even-numbered, Likert-type scales are generally considered ordinal. This is especially true for even-numbered Likert-type scales without a midpoint because they clearly do not meet the criteria for interval scales. For example, the following distances between two adjacent options are unlikely equal:
- Distance between Strongly disagree and Disagree
- Distance between Disagree and Agree
- Distance between Agree and Strongly agree
However, could odd-numbered Likert-type scales with a midpoint be treated as interval scales assuming the following four distances are reasonably equivalent?
- Distance between Strongly disagree and Disagree
- Distance between Disagree and Neutral
- Distance between Neutral and Agree
- Distance between Agree and Strongly agree
Let’s explore this further in the next section.
4.2.2 The Likert scale as an ordinal or interval scale
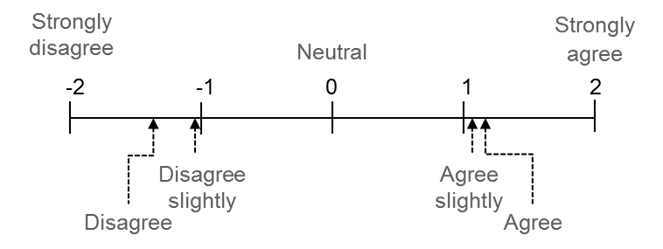
For a 5-point Likert scale to function as an interval scale, survey respondents must perceive the five anchors as being evenly spaced and aligned with numerical values such as -2, -1, 0, +1, and +2, indicating that there is an approximately equal distance between any set of two consecutive points on the scale (Tuckman, 1994[1]).
However, research has shown that survey respondents often perceive the 5-point Likert scale as ordinal rather than interval (Worcester & Burns, 1975[2]). As illustrated in Figure 18, the survey respondents’ perceptions of Disagree and Agree did not align perfectly with numerical values, -1 and 1, respectively. They perceived Disagree to be a little bit toward Strongly disagree, and Agree toward Strongly agree.
Interestingly, the researchers found that when modifiers such as Slightly were added to Disagree and Agree, survey respondents perceived Disagree slightly and Agree slightly as more moderate. This shift in perception brought the anchors closer to the ideal -1 and +1, respectively, helping the scale function more like an interval scale, as shown in Figure 18.
Figure 18 Changed Perceptions After Adding a Modifier Slightly to Disagree and Agree on the Likert Scale (Based on Worcester & Burns, 1975)
Based on this research evidence, it is recommended that you use the modified phrases of the second and fourth anchors when designing a 5-point Likert scale: i.e.,
○ Strongly disagree
○ Slightly disagree (or Somewhat disagree)
○ Neutral
○ Slightly agree (or Somewhat agree)
○ Strongly agree
Why does it matter whether you treat a Likert scale an ordinal or an interval scale? It matters because the level of measurement affects the types of statistical analyses you can appropriately conduct. Interval data allows more statistical analyses than ordinal data. While ordinal data are typically analyzed using frequencies and percentages, interval data can also be summarized using means and standard deviations.
For example, consider the following survey items using a 4-point Likert scale:
My organization values creativity.
○ Strongly disagree
○ Disagree
○ Agree
○ Strongly agree
The results of this ordinal data could be summarized in this way:
- 2% Strongly Disagree
- 5% Disagree
- 25% Agree
- 60% Strongly agree
- 8% Missing data
In contrast, a 5-point Likert scale with modified phrasing may allow you to treat the data as interval (although some researcher may argue that it is still an ordinal scale):
My organization values creativity.
○ Strongly disagree
○ Somewhat disagree
○ Neutral
○ Somewhat agree
○ Strongly agree
In this case, you might code the data with numeric values (e.g., 1 to 5) and calculate mean and standard deviation of responses. Furthermore, average scores obtained from multiple measures (e.g., pre and post, or Branch A vs. Branch B vs. Branch C) can be compared with each other. For example, if Branch A improved its scores from 3.0 to 4.0, and Branch B improved its scores from 3.0 to 5.0, you can conclude that Branch B improved twice as much as Branch A (because equal distances between response options are assumed). With data obtained from the 4-point Likert scale, this type of a conclusion cannot be made (because equal distances between response options are not assumed).
4.2.3 A midpoint as a dumping ground
A midpoint allows survey respondents to express their neutral feelings towards a presented subject (i.e., feeling equally toward agreement and disagreement). However, research shows that some survey respondents may use the midpoint as a dumping ground, especially when they:
- Do not know enough about the content asked in the survey
- Think their answer depends on other factors
- Are not motivated to respond to the survey
- Want to select a more socially acceptable response, especially when their true opinion is negative
This means including a midpoint can lead to incorrect data. So, should you simply exclude the midpoint?
Not so fast! Omitting a midpoint can create other problems. When a midpoint is absent, respondents who genuinely feel neutral about the survey topic may:
- Be forced to choose a side (negative or positive), resulting in inaccurate data
- Choose not to respond to the survey question, resulting in missing data
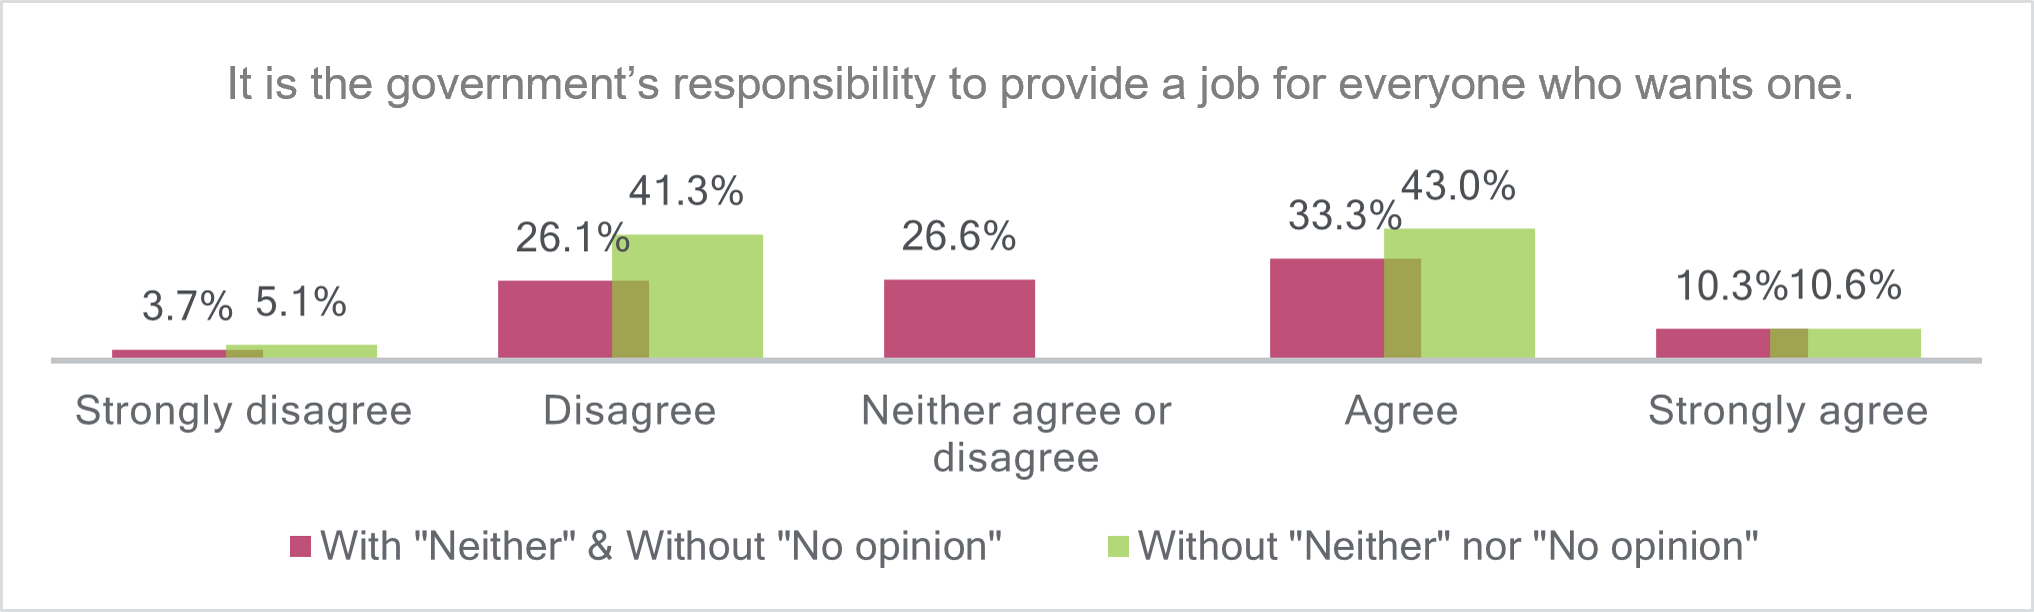
In other words, either choice—including or excluding a midpoint—can potentially lead to inaccurate responses. For example, Figure 19 illustrates how response distributions can change when a midpoint was provided vs. not provided (Johns, 2005[3]). In this public opinion survey, when the Neither option was not available, the 26.6% of Neither responses may have been re-distributed mostly into Agree and Disagree. But it’s unclear which version reflects true responses—the inflated Agree and Disagree responses when Neutral is not allowed or the decreased Agree and Disagree responses when Neutral is allowed. So, what should you do?
Figure 19 Data Distribution Difference When a Midpoint is Available and When It Is Not (Based on Johns, 2005, Table 3, p. 249)
4.2.4 Add I don’t know, not applicable, or no opinion
To address the potential problems described in the previous section—whether or not to include a midpoint—you can offer an additional option such as I don’t know, Not applicable, or No opinion. Not all survey items would need these additional options so you should use your best judgment.
I Don’t Know – Let’s say, you are aware that some trainees missed one or more sessions of a multi-day workshop. If your survey asks about a specific activity they may not have experienced, it would be appropriate to include an I don’t know option. You could still assign 1 through 5 to the five Likert scale options, but exclude I don’t know responses when calculating average scores.
I found the role-play practice very useful.
- Strongly disagree (1)
- Somewhat disagree (2)
- Neutral (3)
- Somewhat agree (4)
- Strongly agree (5)
- I don’t know (0)
Not Applicable – You might add a Not applicable option when survey items do not apply to all respondents. For example, if you are using a standardized survey questionnaire for both face-to-face and e-learning courses, some questions that apply to face-to-face training do not apply to e-learning courses, and vice versa. Rather than forcing a response that could introduce inaccurate data, Not applicable offers a clear opt-out.
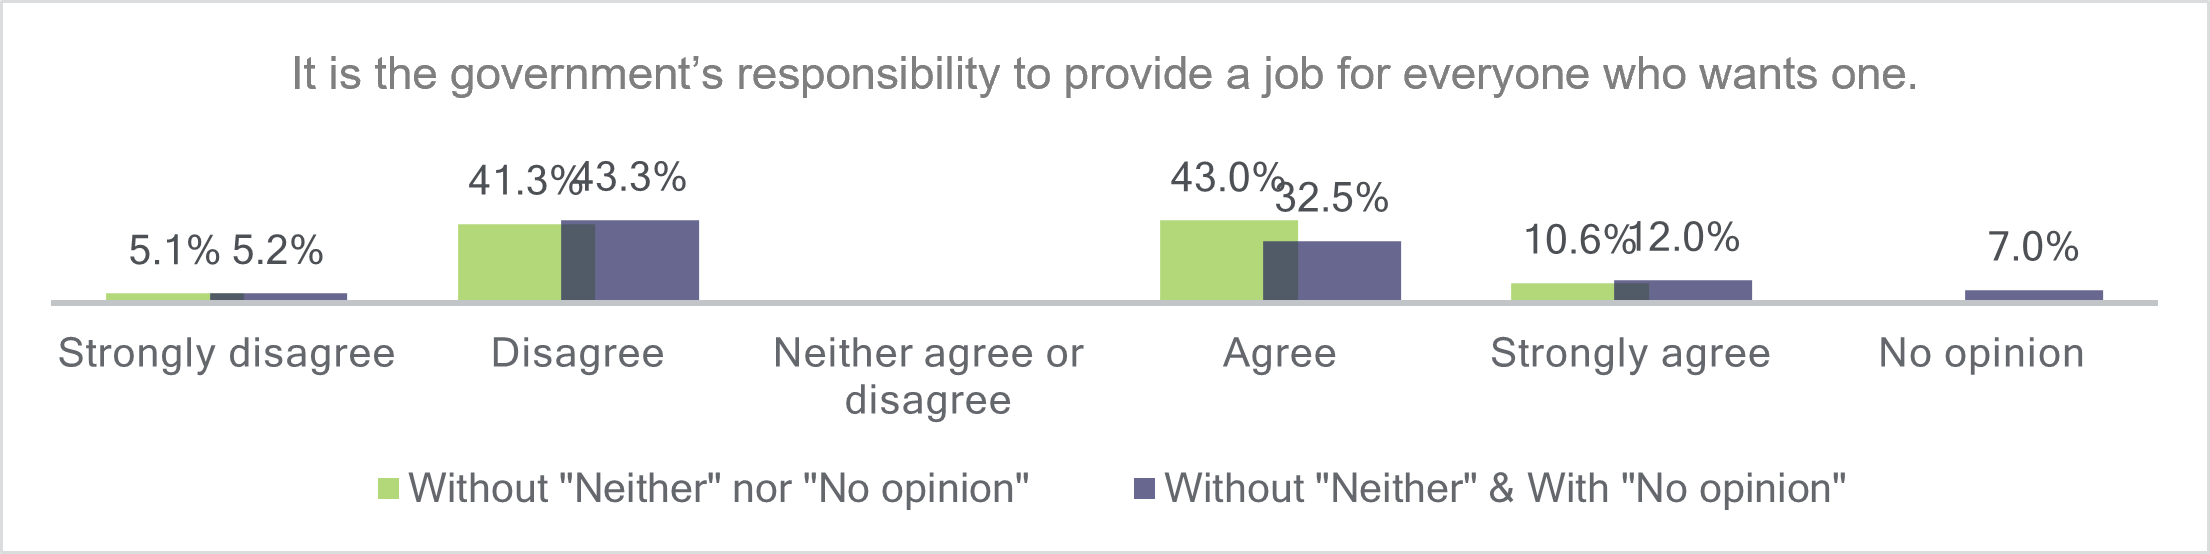
No Opinion – In some cases, you might consider offering No opinion, particularly in public opinion or customer satisfaction surveys. For example, in the public opinion survey described earlier (John, 2005), adding a No opinion option to a 4-point Likert scale redistributed some of the Neutral response from the 5-point version. It appears that the 26.6% who originally chose Neither on the 5-point scale (Figure 19) were reallocated across Strongly disagree (0.1% increase), Disagree (2% increase), Agree (10.5% decrease), Strongly agree (1.4% increase), and No opinion (7%) on the revised scale (Figure 20). It is curious to see if some of the respondents who selected Agree when No opinion was not available (suggesting the social desirability bias) now selected No opinion.
Figure 20 Data Distribution Difference When No Opinion Is Available and When It Is Not (Based on Johns, 2005, Table 3, p. 249)
In conclusion, both including and excluding a midpoint on a rating scale come with advantages and drawbacks. Rather than asking if you should include a midpoint, it is more useful to consider when it is appropriate to do so. You may choose to include a midpoint if you want to allow respondents to express their neutral feelings or if you plan to treat the Likert scale as an interval scale in your analysis. Conversely, you may want to exclude the midpoint if you have a reason to believe that respondents might use the midpoint as a dumping ground. Regardless of your decision, it is important to use the same type of scale consistently across related survey items in your questionnaire, especially if you plan to aggregate responses (e.g., by calculating an average score). Additionally, consider in including options such as I don’t know or Not applicable when appropriate, to further improve the accuracy and interpretability of your data.
- Tuckman, B. (1994). Conducting educational research (4th ed.). Harcourt Brace College Publishers. ↵
- Worcester, R. M., & Burns, T. R. (1975). A statistical examination of the relative precision of verbal scales. Journal of the Market Research Society, 17(3), 181-197. ↵
- Johns, R. (2005). One size doesn't fit all: Selecting response scales for attitude items. Journal of Elections, Public Opinion and Parties, 15(2), 237-264. ↵
