5. Develop Surveys for Different Purposes
5.1 Purpose of the survey and knowledge to be gained from the survey
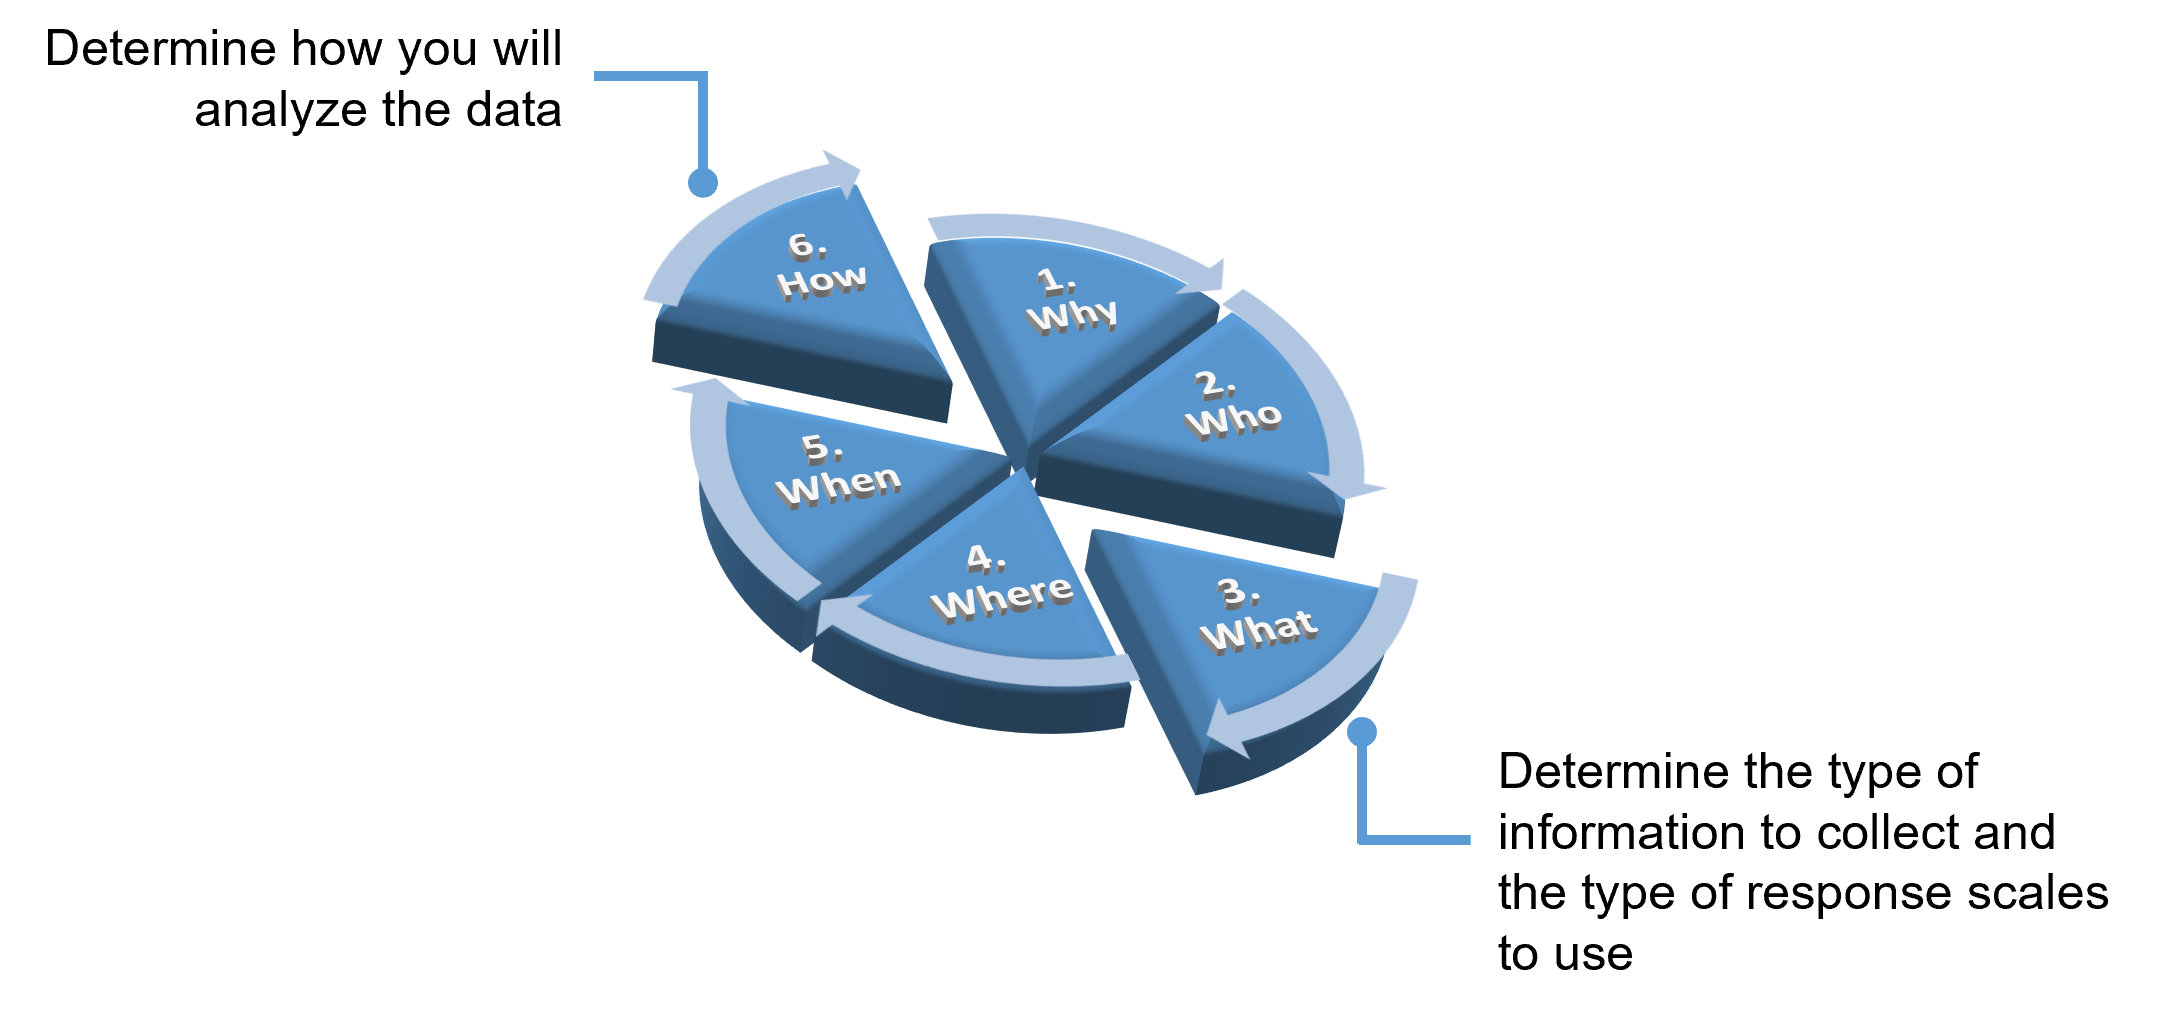
Before designing your survey questionnaire, you must first clearly determine the purpose of the survey—this aligns with the first step in the survey design and data analysis process. Equally important is to keep the end in mind by thinking ahead to the final step of the process—how you will analyze your data and report it. This forward-thinking approach requires you to identify what kind of knowledge you want to gain from the survey and how you intend to present it. In other words, while you are working on the What step (designing survey questions and response scales), you should simultaneously consider the How step (data analysis and reporting), as illustrated in Figure 21.
Figure 21 Project the How Step While Working on the What Step

5.1.1 Developing the right type of survey item for the intended report: Example 1
Consider the three scenarios presented in Table 5 where the purpose of conducting the survey is the same, but the way you plan to report the findings differs:
Table 5 Designing Survey Items to Generate Specific Knowledge to Be Gained
Purpose of the survey: To find out the effectiveness of the job aid
| Design Factors | Scenario 1 | Scenario 2 | Scenario 3 |
|---|---|---|---|
| Specific knowledge to be gained from the survey (how to write the report) | How frequently technicians have been using the job aid: e.g.,
N (X%) technicians use the job aid at least weekly. |
If technicians find the job aid helpful or not: e.g.,
N (X%) technicians have found the job aid helpful. |
How the job aid has helped the technicians: e.g.,
N (X%) technicians have found the job aid helpful in reducing errors. |
| Survey item to be used | Q1. How often did you use the job aid in the last month?
○ Once a day |
Q2. Does the job aid assist you in your job performance?
○ Yes Please describe how the job aid helped or did not help: |
Q3. How helpful is the job aid in assisting you in your job performance? Check all that apply.
○ Helps me complete my job tasks faster |
| Data analysis | Frequency/percentage
No average |
Frequency/percentage
No average |
Frequency/percentage
No average |
In Scenario 1, the survey items is designed to capture factual, non-judgmental information. Reporting the frequency of job aid use does not directly indicate the quality of the job aid itself. For example, some technicians may not have used the job aid because they forgot about it or misplaced it.
In contrast, the survey items in Scenarios 2 and 3 aim to measure perceived quality or value about the job aid. However, due to their different designs, these two survey items produce different types of knowledge about the quality/value of the job aid.
- If your primary goal is simply to determine if the job aid was helpful or not, “Q2 Does the job aid assist you in your job performance?” would be sufficient.
- If you want to learn how the job aid helped the technicians, however, Q2 will not provide enough detail. Instead, you should use a survey item such as “Q3 How helpful is the job aid in assisting you in your job performance?” which can reveal how technicians used the job aid and which aspects they found useful.
When you use Q3, you can still infer whether the job aid was helpful based on responses—so you likely would not need to include both Q2 and Q3 in your survey.
However, even Q3 may not give you a complete picture of the job aid effectiveness. It does not tell you how much the job aid has contributed to achieving specific outcomes. To gain this level of detail, you may use Q4 in Exhibit 5. Q4 is designed to generate the most comprehensive information about the effectiveness of the job aid usage, compared to Q1, Q2, and Q3.
Exhibit 5 A Sample Set of Survey Items That Measure How Much a Job Aid Helped
Q4. Please select an option that indicates how much the job aid has had an impact on how you do your job
| Question | Very much negatively |
Somewhat negatively |
No change | Somewhat positively |
Very much positively |
Never used it |
|---|---|---|---|---|---|---|
| Complete job tasks faster | ○ | ○ | ○ | ○ | ○ | ○ |
| Complete job tasks without asking for help | ○ | ○ | ○ | ○ | ○ | ○ |
| Reduce errors | ○ | ○ | ○ | ○ | ○ | ○ |
When analyzing the data obtained from Q4, you may report the frequencies/percentages of individual opinions, for example:
Twenty and 25 technicians (38% and 47%) reported the job aid made a very positive or somewhat positive impact on completing their job tasks faster, respectively.
Three technicians (6%) indicated no impact on their job performance when using the job aid.
Three and two technicians (6% and 4%) stated that the job aid had a very negative or somewhat negative impact on completing their job tasks faster, respectively.
Alternatively, if you decide to treat this response scale as an interval scale, you might assign numerical values -2, -1, 0 ,+1, +2 (or 1, 2, 3, 4, 5) to the five response options and calculate an average score (excluding Never used it), as shown below:
○ Very much negatively (-2)
○ Somewhat negatively (-1)
○ No change (0)
○ Somewhat positively (1)
○ Very much positively (2)
○ Never used it (excluded)
This approach allows you to summarize the overall impact of the job aid with a single score.
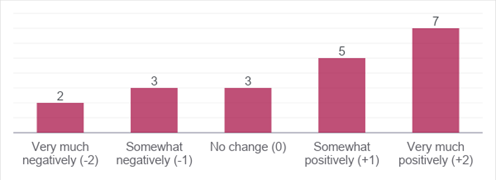
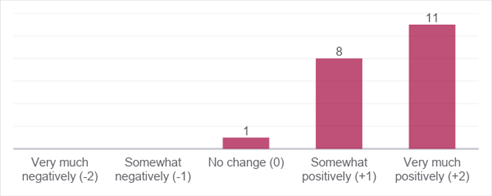
For example, compare the two hypothetical datasets presented in Table 6, Table 7, and the bar graphs (Figure 22 and Figure 23).
- The average score of 0.6 presented in Table 6 means a small positive impact, falling between no change and somewhat positively.
- The average score of 1.5 presented in Table 7 means a substantial positive impact, falling between somewhat positively and very much positively.
This type of information would not be possible with Q2 or Q3 type survey items, which lack the precision necessary to evaluate the degree of impact.
Table 6 Hypothetical Data Results #1
| Question | Very much negatively (-2) |
Somewhat negatively (-1) |
No change (0) |
Somewhat positively (+1) |
Very much positively (+2) |
Never used it (excluded) |
|---|---|---|---|---|---|---|
| Frequency | 2 | 3 | 3 | 5 | 7 | 2 |
Average score (while excluding “Never used it”) = [(-2 x 2) + (-1 x 3) + (0 x 3) + (1 x 5) + (2 x 7)] / (2 + 3 + 3 + 5 + 7) = 12 / 20 = 0.6
Figure 22 A Bar Graph of Hypothetical Data Results #1

Table 7 Hypothetical Data Results #2
| Question | Very much negatively (-2) |
Somewhat negatively (-1) |
No change (0) |
Somewhat positively (+1) |
Very much positively (+2) |
Never used it (excluded) |
|---|---|---|---|---|---|---|
| Frequency | 0 | 0 | 1 | 8 | 11 | 3 |
Average score (while excluding “Never used it”) = [(-2 x 0) + (-1 x 0) + (0 x 1) + (1 x 8) + (2 x 11)] / (0 + 0 + 1 + 8 + 11) = 30 / 20 = 1.5
Figure 23 A Bar Graph of Hypothetical Data Results #2

Although it may be tempting to use survey items like Q3 or Q4 to collect more detailed information, it is not always feasible to know exactly how to ask respondents to rate the quality or value of the job aid—particularly in terms of exactly how it helped them. In such cases, consider the following strategies:
- Interview the job aid developer to understand what the job aid is supposed to accomplish and use this insight to create survey items aligned with the developer’s original intent.
- Interview a small group of technicians (i.e., the actual users of the job aid) to gather feedback on the benefits of using the job aid and develop survey items based on the actual users’ input.
Keep in mind, using a detailed survey item like Q4 can be overkill if your goal is simply to determine whether technicians found the job aid helpful or not. In that case, Q2 would be sufficient. As discussed earlier, if you are using a survey item like Q4, it is not necessary to include Q3.
To summarize, in your survey questionnaire, consider combining items in one of the following ways:
- Q1 (capturing factual usage) + Q2 (measuring perceived helpfulness)
- Q1 (capturing factual usage) + Q3 (measuring how the aid was used)
- Q1 (capturing factual usage) + Q4 (measuring degree of impact)
5.1.2 Developing the right type of survey item for the intended report: Example 2
Let’s review another example. Suppose you are assessing new employees’ job readiness after they have completed an onboarding program, and you’ve created a set of survey items using a 7-point scale. In addition, you also plan to report on whether new employees’ job readiness levels correlate with their prior work experience, and you intend to use Pearson’s r correlation coefficient, which requires interval or ratio-level data.
To conduct this analysis, you need to include an item that captures each respondent’s prior work experience. Between the following two options, which one would you use?
Q1. How many years of prior work experience related to your job responsibilities do you have?
○ 1-2 years of experience
○ 3-5 years of experience
○ 6-9 years of experience
○ 10 or more years of experience
Q2. How many years of prior work experience related to your job responsibilities do you have?
Approximately _____ years
Between the two, Q2 is the better choice for your intended analysis. It captures continuous data, allowing you to calculate Pearson’s r. By contrast, Q1 provides ordinal data which is not appropriate for Pearson’s r. If you happen to use Q1, you may use alterative correlation methods, such as Spearman’s rank-order correlation.
This example again reinforces the importance of keeping the end in mind—if you plan to perform specific statistical analyses, your survey items must be designed to yield data that meet the assumptions of those methods.

