
5. Develop Surveys for Different Purposes
5.3 Sample surveys used during performance analysis
The ultimate goal of training and performance improvement practice is to help organizations improve their outcomes. To achieve the goal, you will often begin by conducting a performance analysis, which involves a series of investigations aimed at uncovering the following:
- Whether there is a gap between the expected and current outcomes
- What the specific performance gap is
- Whether the performance gap is significant enough to warrant intervention
- What likely caused the identified performance gap
- If the probable causes are environmental factors, personal factors, or both
- What solutions could be implemented to reduce or eliminate the performance gap
- Which solutions are more cost-effective than others
- How changes are happening and being managed during the implementation of the selected solution
To investigate these issues, you will use various data collection methods, including surveys. When using surveys, it is important to consider different design approaches depending on the specific purpose of the survey.
5.3.1 Using a research approach common for program evaluations
First, compare this performance analysis situation to a program evaluation situation. When conducting a program evaluation, you may design your survey questionnaire with a set of multiple survey items using the same type of rating scales to determine the overall quality of the program.
For example, if you are investigating the level of job satisfaction (i.e., a construct) as a program outcome, you might develop a set of survey items grounded in Herzberg’s job satisfaction theory, as shown in Exhibit 12. You could administer this survey before and after the program and compare the average scores to determine changes in employee job satisfaction. You may also have groups of high- and low-performing employees complete a survey like the one shown in Exhibit 12 to compare differences between the groups.
This is a research approach, commonly used in program evaluations, and it can also be effectively applied in performance analysis to help identify and quantify performance gaps.
Exhibit 12 A Sample Survey Questionnaire Designed Based on Herzberg’s Job Satisfaction Theory
Please rate your satisfaction level toward each of the following aspects about your job by selecting one of the numbers: 1 = No satisfaction, 2 = A little bit, 3 = Some, 4 = Quite a bit, 5 = High satisfaction.
| Question | No satisfaction 1 |
A little bit 2 |
Some 3 |
Quite a bit 4 |
High satisfaction 5 |
|---|---|---|---|---|---|
| I am praised when I perform well. | ○ | ○ | ○ | ○ | ○ |
| I can be promoted based on my performance level. | ○ | ○ | ○ | ○ | ○ |
| I find my job interesting. | ○ | ○ | ○ | ○ | ○ |
| I find my job challenging enough. | ○ | ○ | ○ | ○ | ○ |
| I see myself grow (develop) while doing my job. | ○ | ○ | ○ | ○ | ○ |
| I am allowed to make my own decisions while doing my job. | ○ | ○ | ○ | ○ | ○ |
With these survey items, you can study if the program has helped increase employees’ job satisfaction. In doing so, you may identify the overall job satisfaction level based on the average score of the data obtained from the multiple survey items. Perhaps, you may conduct this survey questionnaire before and after the program and compare the differences in job satisfaction. This is a research approach, commonly used in program evaluations.
5.3.2 Using an assessment approach in performance analysis
Performance analysis—especially during cause analysis—more commonly requires an assessment approach to explore a broader range of environmental and personal factors that may be contributing to the performance issue.
For example, during your cause analysis, you might begin by interviewing a small, purposive sample of employees to assess probable causes to the performance issue. If those interviews reveal compelling evidence—such as low job satisfaction contributing to low performance—you might then conduct a survey with a larger employee group to validate the findings:
Step 1: Interview with a small purposive sample
Step 2: Identify probable causes
Step 3: Conduct a survey with a large sample to validate the causes
In some cases, you may skip the initial interviews and instead use a well-designed survey questionnaire to assess the overall conditions influencing employee performance, including both environmental and personal factors. When doing so, you can apply established cause analysis frameworks such as Gilbert’s (1978) Behavior Engineering Model[1] or Chevalier’s (2003) updated model[2].
For example, suppose you are conducting a performance analysis at a manufacturing plant and have identified a significant performance gap related to safety violations among production workers. To investigate the causes of this performance gap, you might distribute a survey to both production workers and their supervisors. The survey could explore employees’ understanding of safety-related policies and procedures as well as their actual safety-related behaviors.
In this context, Gilbert’s Behavior Engineering Model (Table 9) can serve as a valuable framework for survey development.
Table 9 Thomas Gilbert’s Behavior Engineering Model
| Category | Information | Instrumentation | Motivation |
|---|---|---|---|
| E: Environmental Supports | Data | Resources | Incentives |
| P: Person’s repertory of behavior | Knowledge | Capacity | Motives |
The Behavior Engineering Model guides you to analyze six factors that contribute to performance outcomes: 1. data, 2. resources, 3. incentives, 4. knowledge, 5. capacity, and 6. motives. Gilbert viewed that these six factors are essential for engineering human behavior and for elevating typical performance to exemplary performance.
Using the six categories, you can develop a survey questionnaire like the one shown in Exhibit 13. If you plan to match the survey data with another set of data (e.g., their supervisor’s data), the survey should be identifiable by including a field for the respondent’s name or ID. Otherwise, you may administer the survey anonymously to encourage more candid responses.
If you decide to survey the supervisors of the production workers, the supervisor survey questionnaire should have slightly modified wording as shown in Exhibit 14.
Exhibit 13 A Sample Survey Questionnaire Designed Based on Gilbert’s Behavior Engineering Model (Employee Version)
Please rate each of the following aspects about your job by selecting a number from the 5-point scale where 1 = Almost never and 5 = Almost always.
| Environmental factor: Data | Almost never 1 |
2 | 3 | 4 | Almost always 5 |
|---|---|---|---|---|---|
| 1. I receive clear expectations about what tasks that I need to complete in my job. | ○ | ○ | ○ | ○ | ○ |
| 2. I receive clear expectations about how well I need to complete my job tasks. | ○ | ○ | ○ | ○ | ○ |
| 3. I receive sufficient guidance to help me perform my job tasks. | ○ | ○ | ○ | ○ | ○ |
| 4. I receive sufficient feedback about my job performance. | ○ | ○ | ○ | ○ | ○ |
| Environmental factor: Instruments | Almost never 1 |
2 | 3 | 4 | Almost always 5 |
|---|---|---|---|---|---|
| 5. I have access to all the tools that I need to use to complete my job tasks. | ○ | ○ | ○ | ○ | ○ |
| 6. I have access to all the information/materials that I need to use to complete my job tasks. | ○ | ○ | ○ | ○ | ○ |
| 7. I am assigned to a job schedule that is optimal for me. | ○ | ○ | ○ | ○ | ○ |
| 8. I find my workplace conducive to good performance. | ○ | ○ | ○ | ○ | ○ |
| Environmental factor: Incentives | Almost never 1 |
2 | 3 | 4 | Almost always 5 |
|---|---|---|---|---|---|
| 9. I face positive or negative consequences depending on the quality of my job performance. | ○ | ○ | ○ | ○ | ○ |
| 10. I receive fair monetary compensation for my job performance. | ○ | ○ | ○ | ○ | ○ |
| 11. I am provided with non-monetary incentives that are meaningful to me. | ○ | ○ | ○ | ○ | ○ |
| 12. I am provided with career development opportunities. | ○ | ○ | ○ | ○ | ○ |
| Personal factor: Knowledge | Almost never 1 |
2 | 3 | 4 | Almost always 5 |
|---|---|---|---|---|---|
| 13. I have sufficient knowledge and skills to perform all my job tasks. | ○ | ○ | ○ | ○ | ○ |
| 14. I receive adequate training or education when I need to gain more knowledge and skills. | ○ | ○ | ○ | ○ | ○ |
| 15. I can develop my knowledge and skills to complete my job tasks better. | ○ | ○ | ○ | ○ | ○ |
| 16. I have knowledge and skills valued by my job. | ○ | ○ | ○ | ○ | ○ |
| Personal factor: Capacity | Almost never 1 |
2 | 3 | 4 | Almost always 5 |
|---|---|---|---|---|---|
| 17. I am physically fit to do all of my current job tasks. | ○ | ○ | ○ | ○ | ○ |
| 18. I am mentally fit to do all of my current job tasks. | ○ | ○ | ○ | ○ | ○ |
| 19. I have aptitudes to perform all of my current job tasks. | ○ | ○ | ○ | ○ | ○ |
| 20. I am an appropriate person to do all of my current job tasks. | ○ | ○ | ○ | ○ | ○ |
| Personal factor: Motives | Almost never 1 |
2 | 3 | 4 | Almost always 5 |
|---|---|---|---|---|---|
| 21. I am intrinsically motivated to do my job. | ○ | ○ | ○ | ○ | ○ |
| 22. I am committed to produce good job performance. | ○ | ○ | ○ | ○ | ○ |
| 23. I am willing to do my best when working on my job tasks. | ○ | ○ | ○ | ○ | ○ |
| 24. I am satisfied with what I can do in my current job. | ○ | ○ | ○ | ○ | ○ |
Let’s say you conducted the survey with a group of plant production workers and the corresponding survey with their supervisors. Table 10 presents partial hypothetical data from the BEM surveys (showing only the Data factor).
In this case, your primary interest is not just to assess the overall quality of the environmental and personal factors based on the overall average scores. Rather, you aim to identify which of the six categories are underperforming and in need of improvement.
To determine which categories may be lacking, you can calculate the average score of the multiple survey items within each of the six Behavior Engineering Model categories. For example, within the Data category:
- Employees’ average score: (4.05 + 3.60 + 2.55 + 2.15) / 4 = 3.09
- Supervisors’ average score: (4.25 + 3.66 + 3.25 + 3.05) / 4 = 3.55
The average scores of 3.09 for employees and 3.55 for supervisors suggest that the Data category may need improvement.
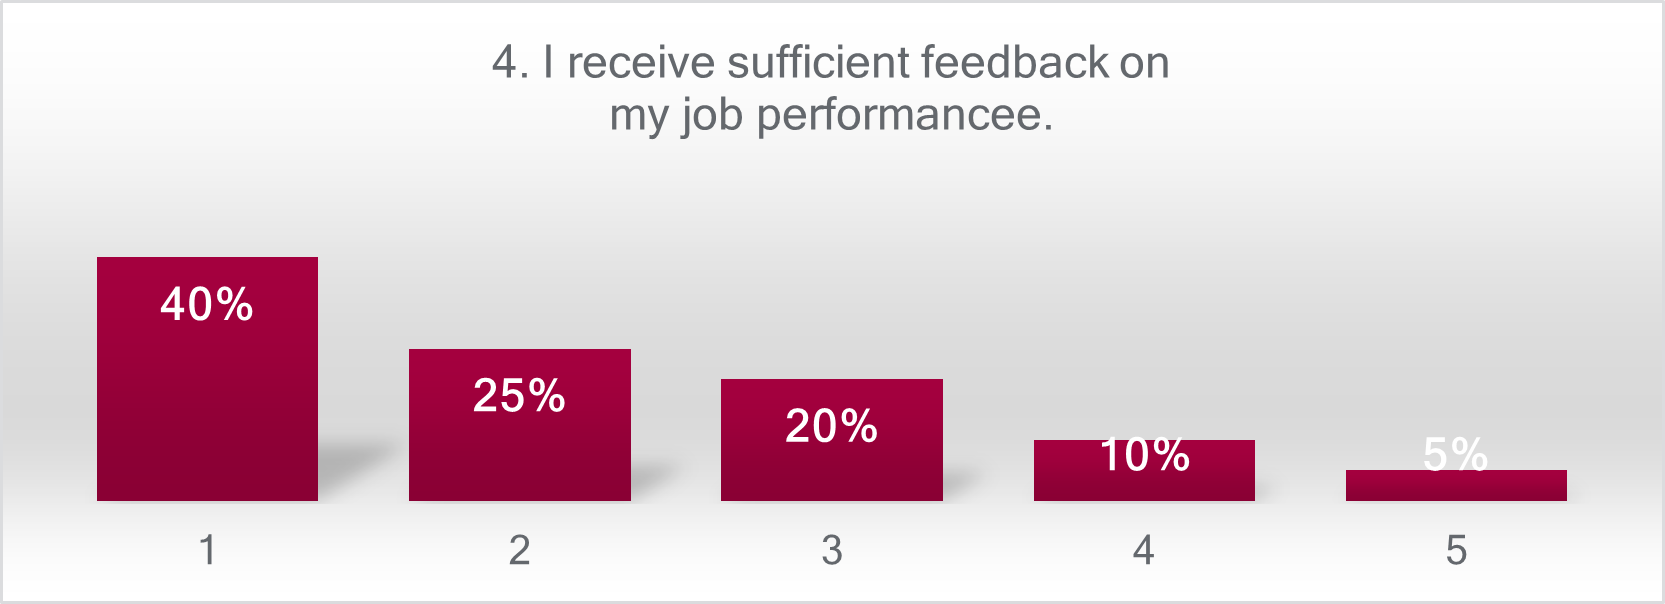
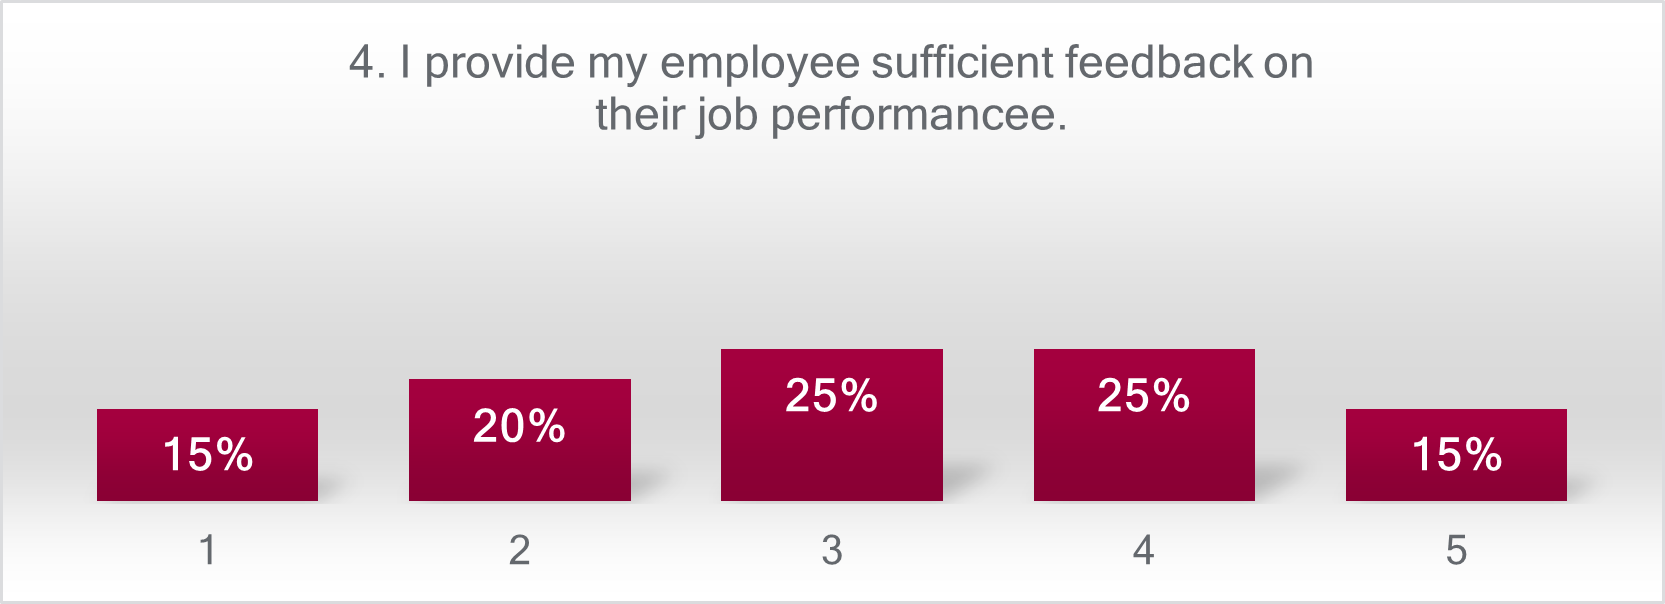
You can go further by investigating which specific items within each category require attention. For instance, in the Data category, survey items #3 and 4 may be of concern. In particular, survey item #4 (see Figure 27) shows a noticeable discrepancy between employees’ and their supervisors’ assessments, which signals a need for further investigation (e.g., through in-depth interviews).
- Employees: “Q4: I receive sufficient feedback on my job performance.” (average = 2.15)
- Supervisors: “Q4: I provide my employee sufficient feedback on their job performance.” (average = 3.05)
Exhibit 14 A Sample Survey Questionnaire Designed Based on Gilbert’s Behavior Engineering Model (Supervisor Version)
Please rate each of the following aspects about each of the employees that you supervise by selecting a number from the 5-point scale where 1 = Almost never and 5 = Almost always.
Employee’s name that you are evaluating:
| Environmental factor: Data | Almost never 1 |
2 | 3 | 4 | Almost always 5 |
|---|---|---|---|---|---|
| 1. I provide my employee with clear expectations about what tasks they need to complete in their job. | ○ | ○ | ○ | ○ | ○ |
| 2. I provide my employee with clear expectations about how well they need to complete their job tasks. | ○ | ○ | ○ | ○ | ○ |
| 3. I provide my employee sufficient guidance to help them perform their job tasks. | ○ | ○ | ○ | ○ | ○ |
| 4. I provide my employee sufficient feedback on their job performance. | ○ | ○ | ○ | ○ | ○ |
| Environmental factor: Instruments | Almost never 1 |
2 | 3 | 4 | Almost always 5 |
|---|---|---|---|---|---|
| 5. I give my employee access to all tools that they need to use to complete their job tasks. | ○ | ○ | ○ | ○ | ○ |
| 6. I give my employee access to all information/materials that they need to use to complete their job tasks. | ○ | ○ | ○ | ○ | ○ |
| 7. I assign my employee to a job schedule that is optimal for them. | ○ | ○ | ○ | ○ | ○ |
| 8. I find my employee’s workplace conducive to good performance. | ○ | ○ | ○ | ○ | ○ |
| Environmental factor: Incentives | Almost never 1 |
2 | 3 | 4 | Almost always 5 |
|---|---|---|---|---|---|
| 9. I give my employee positive or negative consequences depending on the quality of their job performance. | ○ | ○ | ○ | ○ | ○ |
| 10. I give my employee fair monetary compensation for their job performance. | ○ | ○ | ○ | ○ | ○ |
| 11. I provide my employee with non-monetary incentives that are meaningful to them. | ○ | ○ | ○ | ○ | ○ |
| 12. I provide my employee with career development opportunities. | ○ | ○ | ○ | ○ | ○ |
| Personal factor: Knowledge | Almost never 1 |
2 | 3 | 4 | Almost always 5 |
|---|---|---|---|---|---|
| 13. I think my employee has sufficient knowledge and skills to perform all of their job tasks. | ○ | ○ | ○ | ○ | ○ |
| 14. I provide my employee with adequate training and/or education when they need to gain more knowledge and skills. | ○ | ○ | ○ | ○ | ○ |
| 15. I think my employee is able to develop their knowledge and skills to complete their job tasks better. | ○ | ○ | ○ | ○ | ○ |
| 16. I value my employee’s knowledge and skills for their job. | ○ | ○ | ○ | ○ | ○ |
| Personal factor: Capacity | Almost never 1 |
2 | 3 | 4 | Almost always 5 |
|---|---|---|---|---|---|
| 17. My employee is physically fit to do all of their current job tasks. | ○ | ○ | ○ | ○ | ○ |
| 18. My employee is mentally fit to do all of their current job tasks. | ○ | ○ | ○ | ○ | ○ |
| 19. My employee has aptitudes to perform all of their current job tasks. | ○ | ○ | ○ | ○ | ○ |
| 20. My employee is an appropriate person for doing all of their current job tasks. | ○ | ○ | ○ | ○ | ○ |
| Personal factor: Motives | Almost never 1 |
2 | 3 | 4 | Almost always 5 |
|---|---|---|---|---|---|
| 21. My employee is intrinsically motivated to do their job. | ○ | ○ | ○ | ○ | ○ |
| 22. My employee is committed to produce good job performance. | ○ | ○ | ○ | ○ | ○ |
| 23. My employee is willing to do their best when working on their job tasks. | ○ | ○ | ○ | ○ | ○ |
| 24. My employee is satisfied with what they can do in their current job. | ○ | ○ | ○ | ○ | ○ |
Table 10 Hypothetical Survey Data Results Obtained from Employees and Supervisors
| Employees
Environmental factor: Data |
Almost never 1 |
2 | 3 | 4 | Almost always 5 |
Mean |
|---|---|---|---|---|---|---|
| 1. I receive clear expectations about what tasks that I need to complete in my job. | 1 (5%) |
2 (10%) |
2 (10%) |
5 (25%) |
10 (50%) |
4.05 |
| 2. I receive clear expectations about how well I need to complete my job tasks. | 2 (10%) |
3 (15%) |
3 (15%) |
5 (25%) |
7 (35%) |
3.60 |
| 3. I receive sufficient guidance to help me perform my job tasks. | 5 (25%) |
6 (30%) |
4 (20%) |
3 (15%) |
2 (10%) |
2.55 |
| 4. I receive sufficient feedback on my job performance. | 8 (40%) |
5 (25%) |
4 (20%) |
2 (10%) |
1 (5%) |
2.15 |
| Supervisors
Environmental factor: Data |
Almost never 1 |
2 | 3 | 4 | Almost always 5 |
Mean |
|---|---|---|---|---|---|---|
| 1. I provide my employee with clear expectations about what tasks that they need to complete in their job. | 0 (0%) |
1 (5%) |
3 (15%) |
6 (30%) |
10 (50%) |
4.25 |
| 2. I provide my employee with clear expectations about how well they need to complete their job tasks. | 1 (5%) |
2 (10%) |
5 (25%) |
7 (35%) |
5 (25%) |
3.65 |
| 3. I provide my employee sufficient guidance to help them perform their job tasks. | 3 (15%) |
2 (10%) |
5 (25%) |
7 (35%) |
3 (15%) |
3.25 |
| 4. I provide my employee sufficient feedback on their job performance. | 3 (15%) |
4 (20%) |
5 (25%) |
5 (25%) |
3 (15%) |
3.05 |
Figure 27 Bar Graphs Showing Hypothetical Survey Data Results Obtained from Employees and Supervisors
Employees’ assessments
Supervisors’ assessments
- Gilbert, T. F. (1978). Human competence: Engineering worthy performance. McGraw-Hill. ↵
- Chevalier, R. (2003). Updating the behavior engineering model. Performance Improvement, 43(5), 8-14. ↵
