
7. Prepare Survey Data for Analysis and Visualize Data
7.1 Data Screening
After you obtain data from your survey questionnaire, one of the first things you need to do is to screen the data to check if all data looks ready to be analyzed or what needs to be done if you see any abnormalities in your data. These initial data screening tasks include:
- Checking the survey return rate
- Handling missing or incomplete responses
- Identifying and addressing outliers
- Detecting and managing invalid or careless responses
7.1.1 Survey return rate
The first step in your data screening is to check the survey return rate. This begins by recalling how many individuals you invited to participate in your survey. You may have invited the entire target population or a sample from that population (refer to Chapter 1 for a review of population vs. sample).
For example, imagine you want to investigate employee engagement within your organization, which has a total of 2,000 employees. This total represents your target population. You could invite all 2,000 employees to complete your survey, or invite a sample of the population by using methods such as simple random sampling or stratified random sampling (see Chapter 1 for more on sampling methods).
Regardless of your sampling approach, participation in surveys is typically voluntary, so you cannot assume that everyone you invited to your survey will submit their data. Therefore, it is important to track how many people you invited versus how many actually completed the survey.
The survey return rate can be affected by several factors, including the type and length of your survey, organizational culture, the survey sponsorship, how relevant the survey topic is to respondents, timing and duration of the survey, incentives and follow-up strategies. Low return rates (10-30%) are common among busy professionals, especially when they experience survey fatigue (i.e., a state of being tired of receiving frequent survey requests). However, with strong organization support, meaningful incentives, and a participatory culture, you may achieve return rates of 50% or higher.
In your survey report, you want to document the number of people you invited to the survey, number of people who completed the survey, and the calculated survey return rate. Below is an example of how to present this in your report:
A random sample of 460 employees from a total of 2,000 employees was invited to voluntarily participate in the survey. Of those invited, 200 completed the survey, resulting in a return rate of 43.5%.
7.1.2 Missing data (incomplete responses)
A survey return rate of 43.5% does not necessarily mean that all submitted surveys contain complete responses. When participation is voluntary, it’s common that you do not set your survey items to be required (that is, the survey respondents may skip survey items if they want to or accidentally). This leads to missing data—visible as empty cells in your Excel data file.
It is important to distinguish missing data from nonresponse data. Missing data refers to incomplete responses from those who submitted the survey. In contrast, nonresponses refer to individuals (in the above example, 56.5%) who did not complete the survey at all.
For example, suppose your survey consists of five survey items, and 200 employees submitted their responses (n = 200). Some respondents skipped one or more items, resulting in incomplete data (each respondent is referred to as a case). Now, you need to decide how to handle these missing values. Below are several common situations and corresponding strategies. You may use a combination of multiple methods.
Situation 1: A small number of respondents (cases) have many missing values
You may exclude these cases from your analysis. For example, if two respondents did not complete 4 out of 5 items (80% missing), it is reasonable to remove the two cases. Then, your adjusted sample size is: n = 200 – 2 = 198.
Situation 2: Many respondents (cases) skipped the same survey item
It’s possible that many respondents did not complete the same survey item—for example, Q5 in your survey. Maybe Q5 was irrelevant or unclear to them. Then, you may consider removing Q5 from your analysis. In other words, you analyze 200 cases on 4 survey items (excluding Q5).
Situation 3: A small number of respondents (cases) missed different survey items
Usually, missing data are spread out in your Excel data file. Let’s say, 15 respondents did not complete one or two survey items (all different survey items). There are a few ways to handle the missing data:
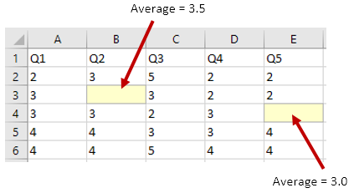
Replace missing data with average scores:
This method is used when there are only a couple of missing data, and it is performed on each survey item. For example, let’s say one respondent skipped Q2 (cell B3), and another respondent skipped Q5 (cell E4) (Figure 44). Calculate the average score of the complete data of Q2 (let’s say, average = 3.5) and enter the average score (3.5) in cell B3 and calculate the average score of the complete data of Q5 (let’s say, average = 3.0) and enter the average score (3.0) in cell E4.
Figure 44 Replace with Average Scores
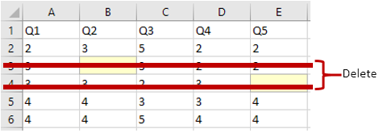
Listwise deletion:
You delete the cases that contain any missing value (Figure 45); that is, when 15 out of 200 respondents have at least one missing data, your sample size n = 200 – 15 = 185.
Figure 45 Listwise Deletion
Pairwise deletion:
You analyze individual survey items with all available cases without deleting the cases that contain any missing value. You leave the missing data cell empty and calculate average scores of individual survey items (Figure 46).
Figure 46 Pairwise Deletion
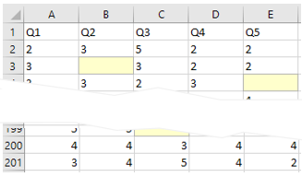
In doing so, you may need to present average scores of individual survey items with different sample sizes, as shown below:
| Survey Item | Mean |
|---|---|
| Q1 | 4.3 (n = 200) |
| Q2 | 3.5 (n = 199) |
| Q3 | 3.9 (n = 198) |
| Q4 | 3.4 (n = 200) |
| Q5 | 3.0 (n = 199) |
7.1.3 Outliers
Outliers are extreme values, unusually high or low compared to the rest of your dataset. Because they can distort your results and conclusions, it is important to identify outliers and decide how to handle them. In some cases, you may exclude the case with an outlier; in others, you may investigate further before making a decision. Below are a couple of examples.
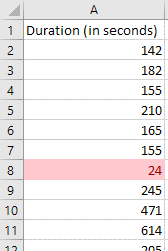
Time for completion:
Outliers can be found when checking whether respondents spent a reasonable amount of time completing the survey. For example, if your web-based survey platform records response times, and you expect the survey to take 2-3 minutes to complete, but find that a few respondents finished in just 24 seconds, these are likely outliers. If you estimate that it is almost impossible to complete the survey in such a short time (if they carefully read each survey question before they clicked on an option), then you may reasonably assume these responses reflect low engagement. In such cases, you might treat them as invalid data and exclude them from analysis.
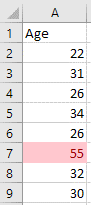
Unusual values (e.g., age):
Outliers can also emerge in specific survey responses due to data entry errors, misinterpretation, or other factors. For example, you asked respondents to enter their age and expected values between 20 and 40, but one response is “55” and another is “333”. In these cases, determine whether the outlier is a valid but unusual response (e.g., a genuinely older participant), or it is a typo or data entry error. Based on your evaluation, you can decide to keep the outlier, correct it (if possible), or treat it as missing data and exclude it from analysis.
7.1.4 Invalid data (careless responses)
When using 4-, 5-, or 7-point Likert-type response scales, you may observe unusual response patterns. For example, if most respondents selected 4s and 5s on a 5-point scale, but a couple of respondents selected 1s and 2s, those low scores may initially seem like outliers. However, these are not true statistical outliers—they may still be plausible responses. it is possible that some respondents misinterpreted the direction of the response scale—for instance, selecting a 1 (“Poor”) when they actually intended to select a 5 (“Excellent”). This kind of mistake is considered a careless response. Below are several situations and ways to detect careless responses.
Contradictions between quantitative and qualitative data:
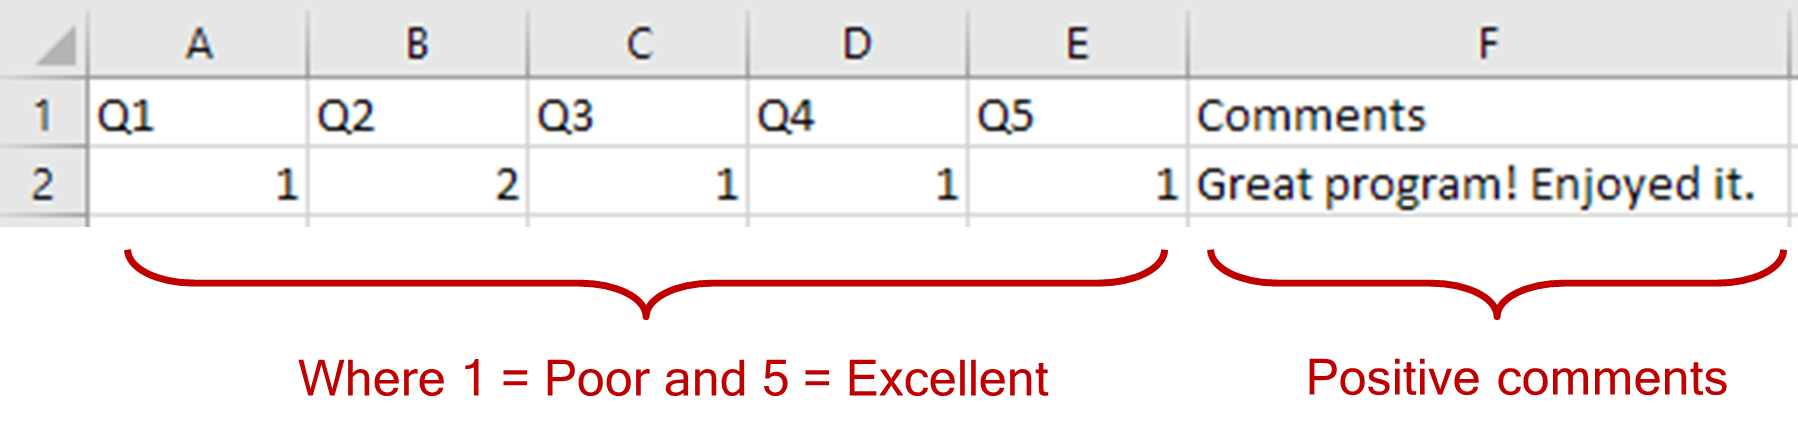
Careless responses may become evident when you compare quantitative data with corresponding open-ended (qualitative) responses. For example, if a respondent selects mostly 1s on the scale (indicating dissatisfaction), but writes very positive comments in the open-ended section, this inconsistency suggests the respondent may have misread the scale or responded carelessly (Figure 47). If you have clear and compelling evidence of a careless response, you may consider correcting the data—for example, by reverse-coding the quantitative responses to better align with the qualitative feedback.
Figure 47 Contradicting Quantitative and Qualitative Data
Contradictory responses from paired survey items:
You may detect invalid data by using paired survey items that measure similar or opposite constructs. For example:
- I think the course is well organized.
Strongly disagree 1 2 3 4 5 Strongly agree - The course organization was:
Very confusing 1 2 3 4 5 Very clear
You would expect responses to both items to be aligned—if someone rates the course as well organized, they should also rate the organization as clear.
You may also use positively and negatively worded item pairs, where the negatively worded item needs to be reverse-coded:
- I think the course is clearly organized.
Strongly disagree 1 2 3 4 5 Strongly agree - I found the course organization to be confusing.
Strongly disagree 1 2 3 4 5 Strongly agree (← to be reverse-coded)
If responses to such paired items contradict each other (e.g., a high score on both the positive and negative item), this inconsistency may indicate carelessness or confusion. In such cases, it’s helpful to examine other data from the same respondent for additional abnormalities.
Zero standard deviation:
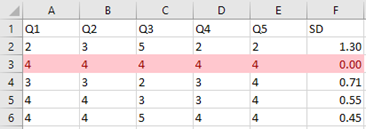
Another method to detect potentially careless responses is to look for zero standard deviation across all survey items for a respondent. This occurs when a respondent selects the same rating for every question. This can be easily identified in Excel by calculating the standard deviation (SD) for each respondent’s row. A standard deviation of 0 means there was no variation in their responses (Figure 48).
Figure 48 Zero Standard Deviation Detected
However, a zero standard deviation alone is not sufficient to conclude the data is invalid. It’s possible that the uniform responses genuinely reflect the respondent’s opinion. But if this is combined with other red flags—such as very short completion time—you may reasonably decide to treat the data as careless and exclude it.
To wrap up, in this example, you received 200 completed surveys from 460 employees, resulting in a 43.5% return rate. After screening the data for missing values, outliers, and careless responses, you may end up replacing or excluding certain cases. These decisions should be clearly documented in your report. Below is an example of a statement you may include:
During the data screening process, three missing data were replaced with item averages. Two cases were removed due to evidence of careless responses—each completed the survey in under 30 seconds and had zero standard deviation across items. The final sample size for analysis was: n = 198.
