7. Prepare Survey Data for Analysis and Visualize Data
7.2 Chapter activity: How would you do your data screening?
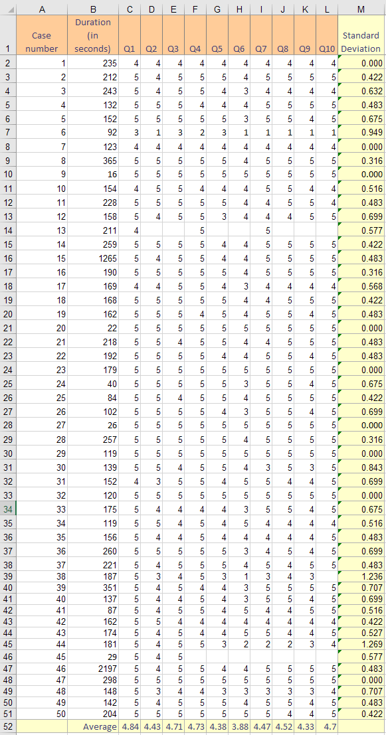
Imagine you administered a survey questionnaire designed to measures employee engagement levels, consisting of 10 survey items. See the first tab “Ch.7.2 Data screening” in Ch7 Data Screening and Charts.xlsx (Figure 49), which displays the dataset you collected from 50 employees.
You are asked to perform your data screening based on the following criteria:
- If any case has 7 or more missing values, delete the case.
- If any case has 1, 2, or 3 missing values, replace the missing data with the case average scores.
- Delete any cases with careless responses indicated by both:
- Duration under 30 seconds, and
- Standard deviation of zero
The “Ch.7.2 Data screening” tab already presents the Standard Deviation values in the “M” column and the average scores of individual survey items in the last (52nd) row.
Report your decisions by filling in the following:
- Based on Criterion #1, I will delete case number(s) ___.
- Based on Criterion #2, I will replace the case number ___’s cell ___ (e.g., C10) with an average score of ___.
- Based on Criterion #3, I will delete case number(s) ___.
Figure 49 An Excel Data File for Data Screening