
7. Prepare Survey Data for Analysis and Visualize Data
7.0 Introduction
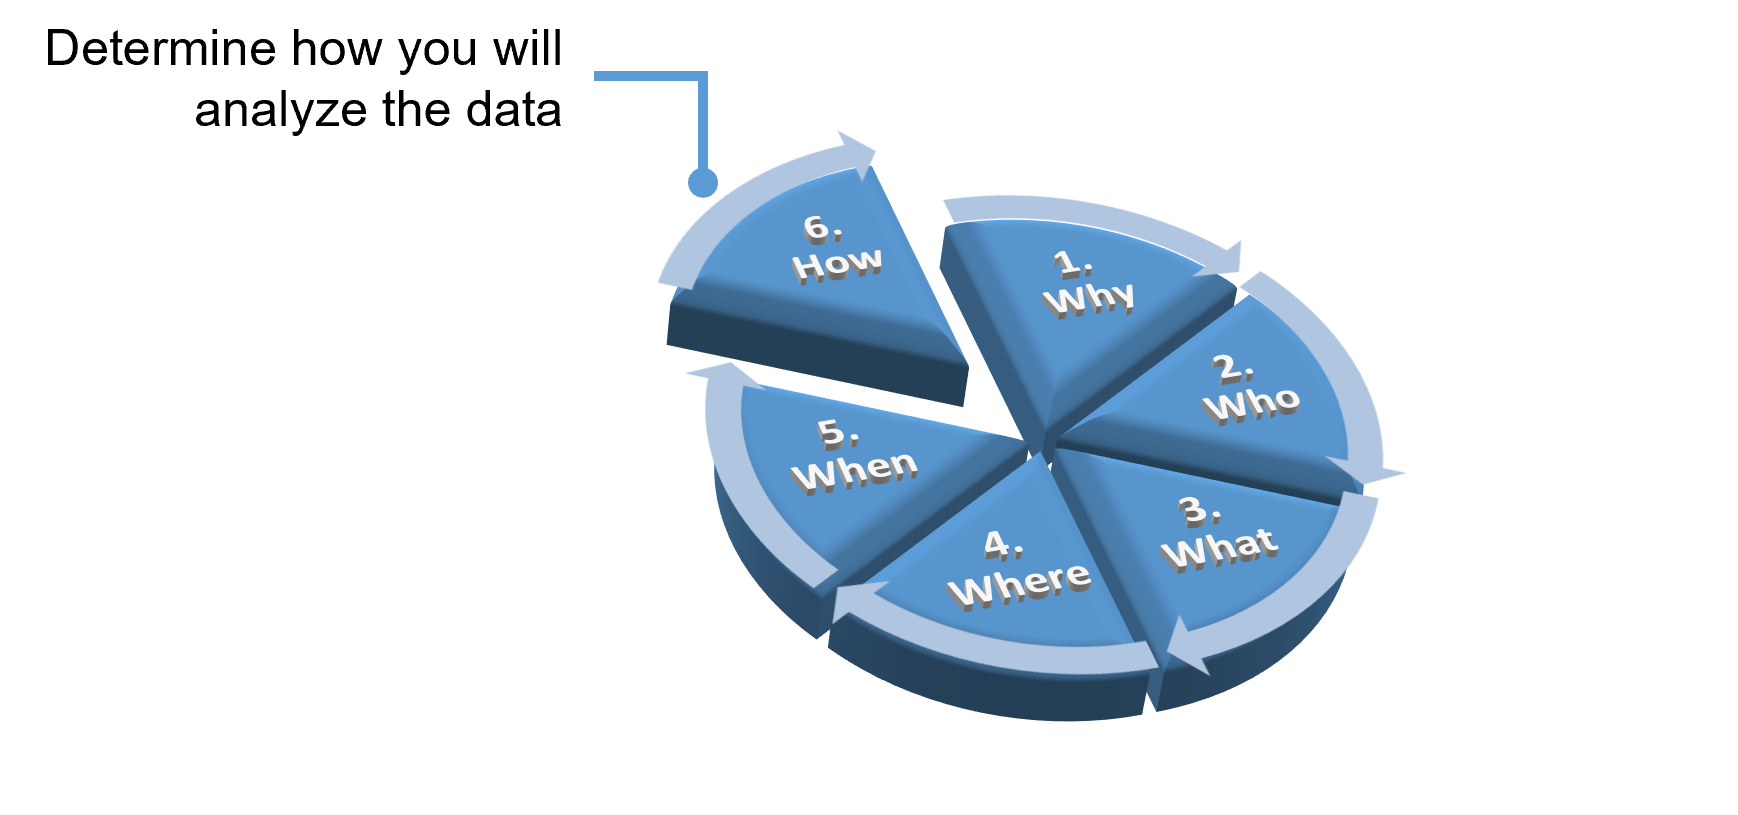
You may have administered survey questionnaires with closed-ended questions to collect data during projects involving evaluation, performance analysis, or instructional design. In the final How step of the survey design and data analysis process (Figure 43), the focus shift to analyzing the quantitative data obtained from your surveys. One commonly used tool for this purpose is Excel, which offers practical features for analyzing quantitative survey data.
Figure 43 The How Step in the Survey Design and Data Analysis Process
Learning Objectives
After completing this chapter, you will be able to:
- Explain the purpose of data screening
- Identify common methods used in data screening
- Describe the benefits of visually presenting data
- Identify data visualization techniques using Excel
