
Exclusive Access: Understanding socioeconomic inequality’s impact on perceptions of inclusion among university students
Paige Lancourt
Introduction
The current state of public and private universities in the United States presents a pervasive and troubling paradox in American society: that is, college degrees are typically associated with higher incomes across lifetimes, but debt-free access is becoming increasingly limited for many individuals. Not only is access to higher education narrower for students from lower socioeconomic statuses than their more affluent peers, but research also shows that even if low-income students do pursue higher education; they often see poorer academic performances in classrooms, and are more likely to drop out before graduation (Alon, 2009; Sacks, 2007). While scholarship across disciplines agrees that socioeconomic background can impact outcomes for students, few studies have sought to directly measure how personal demographics, like socioeconomic background, age, and race, are part and parcel of the continuous institutional experience of a college classroom. In short, perhaps there is not only an access problem in higher education, but an inclusion dilemma once students from low-income backgrounds attend college, as well.
Statement of the Problem
My research seeks to understand how personal demographics, with particular attention to socioeconomic class, impact university students’ perception of their own inclusion and acceptance, or lack thereof, in a specific college setting. Drawing these connections between the demographic characteristics of college students and their perceived sense of inclusion emboldens a more nuanced understanding of academic performance, overall course satisfaction, and importantly, what sorts of interventions keep students in the classroom longer, regardless of their background.
The experience of inclusion or exclusion is personal, but should also be viewed in terms of larger social class constructs. As Collins and Parker state: “exclusion is primarily a collective act intended to promote class formation through careful selection of successors.” To combat this, many universities, Boise State University among them, strive for what is deemed “inclusive excellence” (Williams, et al., 2005), by paying more attention to how teaching can celebrate diversity, strive for equity, and foster inclusion in the classroom. Inclusive excellence, at any level, must be understood in the context of wide-spread social, political, and economic institutions. This study is important for unpacking how teachers, educators, and administrators can combat the reality that an inclusive experience for students from diverse backgrounds is not the default or given. In truth, this research confirms that many students from low socioeconomic backgrounds continue to feel a sense of exclusion in the college classroom, and such feelings are less likely to be related to the politics of a specific classroom, but rather the life-long institutional experience of a persistent socioeconomic class divide.
Method
This study relied on a mixed-method research design to analyze results, with data gained primarily through a qualitative anonymous survey. Upon completion of the qualitative data collection, survey responses were coded into numerical scores to measure potential correlations between independent and dependent variables through a linear regression analysis. This choice in research design provided the best method to measure “inclusion,” which was the dependent variable in this study. A simple regression allowed for a predictive analysis of how a quantified interpretation of socioeconomic status, which served as the independent variable, impacted a participant’s perception of their own inclusion.
Data Collection
The anonymous survey, administered through Qualtrics, was taken by students who were currently enrolled in, or had previously taken the online version of the course POLS 101: American National Government at Boise State University, between Fall of 2019 and Spring of 2020. The survey was divided into three layers. The first layer asked multiple-choice questions about demographic characteristics, with particular attention to socioeconomic class to be tested as the explanatory independent variable. Seeking to measure the dependent variable, the second layer asked questions about personal experiences of inclusion or exclusion at Boise State University and in Boise State classrooms, where students responded on a possible answer spectrum of strongly disagreeing, to strongly agreeing. Other experience-related questions in this layer had responses ranging from “never” to “always.” The third layer, which ended up being extraneous to the study, asked participants about their experience specifically in POLS 101, and compared online experiences to in-person classroom experiences. The survey, with all three layers, included 45 questions in total. The final two questions allowed students to answer in a narrative fashion to provide the researcher with purely qualitative feedback about reasons for taking online courses. The data collection period lasted approximately 60 days. In total, 28 participants completed the survey (n=28).
Data Analysis
Once data collection was complete, responses had to be coded numerically in order to analyze the relationship between variables. In order to achieve more uniformity in measuring participants’ subjective sense of inclusion, the survey asked a variety of questions that, combined, factored into an overall “inclusion score” for each participant. Questions such as “I tend to feel encouraged and included during group classroom activities, such as peer discussion or group work” and “I find it easy to discover places on campus that bring a sense of community and belonging” had participants respond in one of the following ways: strongly disagree, disagree, somewhat disagree, neither agree nor disagree, somewhat agree, agree, or strongly agree; with strongly disagree accounting for a score of 1 for that specific question, and strongly agree accounting for a score of 7. Overall, five questions had potential answers ranging from 1-7, and two questions asked students to respond with potential answers being always, most of the time, about half the time, sometimes, or never; with always accounting for a score of 1, and never accounting for a score of 5. These two questions scored “always” responses with a score of 1 to stay consistent with the previous questions, since the “always to never” questions identified inverse instances of exclusion, rather than inclusion. This overall inclusion score served as the dependent variable for this study, and after all responses were coded and summed, 28 participants had inclusion scores ranging from 24 to 43. The higher the score, assumedly, the more included the given participant felt in a number of scenarios that could regularly occur in a university classroom or campus environment. The lower the score, the more excluded a given participant felt on a regular basis across multiple University group-based scenarios.
While this survey measured a number of potential demographic characteristics, such as race, ethnicity, age, and primary language, the variable that most interested the researcher, and saw the most statistically significant results, was socioeconomic status. Measuring socioeconomic status as accurately as possible required the construction of multiple and differing survey questions. While three of the survey questions relied on “perception” as measurement, an example being “I perceive my socioeconomic status to be more affluent than my peers,” other questions asked about a participant’s familial educational background. The American Psychological Association states that educational attainment is one of the more accurate measurements of income-levels in the United States, and questions about parental education give insight into the socioeconomic status of students prior to earning steady incomes themselves (APA 2015). For these questions about the parents’ education background, participant responses were coded from 1-4. An assignment of 1 represented a scenario where neither of the subject’s parents attended a four-year college. An assignment of 2 suggested that one or both of the subject’s parents attended a four-year college. An assignment of 3 meant that one or both of the subject’s parents graduated from college and received a bachelor’s degree. Finally, an assignment of the number 4 suggested that one or both parents obtained an advanced degree. These questions, combined with similarly structured numerical ranges derived from questions about the participant’s perceived income-level growing up and current income, produced a number that represented each participant’s socioeconomic status. Overall, a smaller number suggested that the participant’s socioeconomic status was lower compared to their peers who also took the survey. A higher number suggested that the participant’s SES was comparatively higher than others who took the survey. SES scores ranged from 4-12.
Results
A simple linear regression was performed to analyze the relationship between socioeconomic status and inclusion scores.
Where, Y = 1.232x + 26.137
Multiple R = 0.5819
R2 = 0.3386
P-value = 0.001162481
Confidence Interval: 95%
Table 1
Regression Statistics
Multiple R 0.5818558726
R Square 0.3385562565
Adjusted R Square 0.3131161125
Standard Error 3.55567757
Observations 28
ANOVA
df SS MS F Significance F
Regression 1 168.2503682 168.2503682 13.30795363 0.00116248133
Residual 26 328.7139175 12.64284298
Total 27 496.9642857
Coefficients Standard Error t Stat P-value Lower 95% Upper 95%
Intercept 26.13659794 2.643748617 9.886188788 0.0000000003 20.70229488 31.570901
Ind. Variable. 1.231958763 0.3377073645 3.648006803 0.001162481 0.5377913404 1.9261261
Table 2
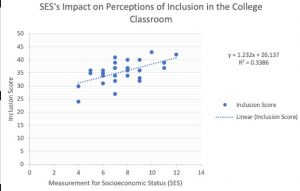
As the results show, a positive correlation was discovered between independent and dependent variables. On average, the higher the inclusion score for a given participant, the higher the predicted socioeconomic status was of that same participant. While the low R-squared value suggests that only 34% of the response variable variation is completely explained by the above-linear model, this was expected due to the fact that research is trying to predict human behavior. Importantly, there remained other statistically significant predictors in this model that supported the conclusion that a positive correlation exists between variables. The Multiple R value of 0.58 accounts for the positive slope of the linear equation, and very low p-value confirms the model’s statistical significance at a 95% confidence level.
Conclusions
These findings support the conclusion that a statistically-significant relationship exists between survey respondents’ socioeconomic status and their perception of inclusion in the college classroom. Socioeconomic status remains an important, but often overlooked, factor that continues to affect students once they begin college life. The survey pool was quite homogenous across certain demographics, of the 28 respondents, 93% identified as female, and 89% identified as white. While such racial and ethnic homogeneity was not the goal, it did lead research to more definitively conclude that socioeconomic status served as a major predictor of a participant’s perceived sense of exclusion or inclusion. For example, even if the participant was white and primarily spoke English growing up, predictions suggest that if the same participant came from a low-income background, they were more likely to feel excluded from certain college settings. Because the survey pool was limited, research could not confidently say whether age alone or race alone correlated to increased feelings of exclusion, but a separate analysis showed that if race, age, and language factored in as independent variables in addition to SES, the correlation between demographic characteristics and inclusion was slightly stronger than the original model (multiple R = .5849). Future surveys related to this research question would pose more in depth inquiries about age, which is another often overlooked demographic factor, in relation to the collegiate classroom experience.
Implications
While this study is limited to a specific university, the conclusions confirm an anecdotal phenomenon that is prevalent across universities in the United States: the college experience, if there is an experience at all, differs depending on one’s social class. Even if college becomes accessible to students from low-income backgrounds, findings here show that previous and current socioeconomic status will still affect experiences in the classroom. Research demonstrated that the experience of exclusion for most students was pervasive beyond one classroom, and suggested there is a larger institutional issue at hand when it comes to the continued exclusion of students from low-income backgrounds.
Yet despite these important findings, universities have continued to push aside, or not fully unravel, the components of their students’ demographic makeups when it comes to socioeconomic status. In simplified terms, a higher inclusion score in this study suggested that the participant in question looked like, and came from a similar background to, the majority of students enrolled at Boise State University. Boise State University, in the spring of 2020, had 53% female undergraduate enrollment, and 73% of total undergraduate enrollees were white (Boise State University Office of Institutional Research 2020). While statistics about federal aid and grants were expressed in general terms, such information sheds minimal light on just how many students from lower-income backgrounds struggle to reap the communal benefits of university life. The conservation surrounding diversity, equity and inclusion at universities must include a stronger confrontation of the lingering and growing class divide in American education, and importantly, how this divide persists across four years time.
This leads to a final and important point: that it is not possible to talk about class differences in American society, and specifically in education, without acknowledging the long history of exclusion based on race in this country. Access to four-year universities for low SES students remains limited across races, but the consequences of limited access to quality and affordable higher education are far more wide-spread, and historically compounded by other discriminatory barriers, in African-American, Hispanic and other marginalized communities (Sugrue, 1996; Katznelson, 2005; Chomsky, 2007). When striving for inclusion in particular, this study found evidence that the presentation of a number of minoritized identities was more likely to enhance one’s sense of exclusion. This should serve as an important reminder for researchers to consider how identities intersect when analyzing how inclusive a college setting is (Crenshaw, 1989). Future studies should not ignore how such complex identities fit into the structural economic, social, and political obstacles for people of color, and people from low-income backgrounds. All in all, many universities across the country have made important strides in creating a more inclusive college experience; but additional remedies are needed to make sure students from low-income backgrounds thrive academically and personally in a university setting.
Limitations
The timing and nature of the data collection for this study was both revealing and limiting. Firstly, data was collected as the COVID-19 pandemic hit the United States in early 2020 and shifted most classes online. Students reported that the pandemic would be one of the primary reasons for taking online classes in the future, and, in general, the mental challenges of living in a pandemic likely impacted how participants responded to various questions. Secondly, a more robust quantitative analysis would result from a larger sample size. The limited sample size revealed an additional limitation, in that participants overwhelmingly identified as white and female. Although limiting, this was also revealing, as it made for interesting comparisons among white females who answered questions about inclusion and belonging differently. Such a racially homogenous and overwhelmingly female participant pool brought particular attention to “age” and “socioeconomic status” as important demographic factors. Future research would still like to more acutely analyze racial identity’s role in inclusion, age of students, and how multiple identities intersect with one another.
References
Alon, Sigal. (2009). The Evolution of Class Inequality in Higher Education: Competition, Exclusion, and Adaptation. American Sociological Review (2009), 74 (October:731-755).
Bauman, G. L., Bustillos, L. T., Bensimon, E. M., Brown II, C. M., and Bartee, R. D. (2005). Achieving equitable educational outcomes with all Students: The institution’s roles and responsibilities. Making Excellence Inclusive Initiative. AAC&U Publishing.
Bernstein, Mary. (2005). Identity Politics. Annual Review Sociology 31, 47-74.
Boise State University Office of Institutional Research. (Spring 2020). Student Enrollment Summary – Census Day, March 15. https://d25vtythmttl3o.cloudfront.net/uploads/sites/501/2020/03/Enrollment-Summary-Spring-2020-Census.pdf.
Boise State University Office of Institutional Research. (Fall 2020). Student Enrollment Summary – Census Day, October 15. https://www.boisestate.edu/ir/files/2020/10/Enrollment-Summary-Fall-2020-Census.pdf
Boise State University Office of the President. (2017). Statement of Diversity and Inclusion. https://www.boisestate.edu/president/statement-of-diversity-and-inclusivity/.
Bourdieu, P. (1986). The Forms of Capital. In J.G. Richardson, (Ed.) Handbook of Theory and Research for the Sociology of Education. (pp. 241-258). Greenwood Press.
Bowman, N. A. (2011). Promoting participation in a diverse democracy: A meta-analysis of college diversity experiences and civic engagement. Review of Educational Research, 81, 29–68. doi:10.3102/0034654310383047.
Chomsky, A. (2007). “They Take Our Jobs!”: And 20 Other Myths about Immigration. Beacon Press.
Collins, R. (1971). Functional and Conflict Theories of Educational Stratification. American Sociological Review 36, 1002-1019.
Cramer, K. J. (2016). The Politics of Resentment: Rural Consciousness in Wisconsin and the Rise of Scott Walker. The University of Chicago Press.
Crenshaw, K. (1989). Demarginalizing the Intersection of Race and Sex: A Black Feminist Critique of Antidiscrimination Doctrine, Feminist Theory and Antiracist Politics, University of Chicago Legal Forum, 1989(1), 138-168 (Article 8). http://chicagounbound.uchicago.edu/uclf/vol1989/iss1/8.
Dahl, R. A. (1971). Polyarchy: Participation and Opposition. Yale University Press.
Downs, A. (1957). An Economic Theory of Democracy. Harper and Row, Publishers, Inc.
Ellemers, N., & Jetten, J. (2013). The Many Ways to Be Marginal in a Group. Personality and Social Psychology Review 17(1), 3-21.
Hurtado, S. (2007). Linking diversity with the educational and civic missions of higher education. Review of Higher Education 30(2), 185–196.
Jansen, W. S., Otten, S., Van Der Zee, K. I. & Jans, L. (2014). Inclusion: Conceptualization and measurement. European Journal of Social Psychology, 44, 370-385.
Katznelson, I. (2005). When Affirmative Action was White: An Untold History of Racial Inequality in Twentieth-Century America. W.W. Norton & Company.
Measuring Socioeconomic Status and Subjective Social Status. (2015 May). American Psychological Association. Retrieved from: https://www.apa.org/pi/ses/resources/class/measuring-status#:~:text=SES%3A%20Measures%20of%20occupational%20prestige,then%20classified%20into%20occupational%20categories.
Olson, M. (1965). The Logic of Collective Action: Public Goods and the Theory of Groups. Harvard University Press.
Parkin, F. (1979). Marxism and Class Theory: A Bourgeois Critique. Tavistock.
Putnam, R. D. (2000). Bowling Alone: The Collapse and Revival of American Community. Simon & Schuster Paperbacks.
Sacks, P. (2007). Tearing Down the Gates: Confronting the Class Divide in American Education. University of California Press.
Saunders, S., & Kardia, D. (1997). Creating inclusive college classrooms. Center for Research on Learning and Teaching. https://crlt.umich.edu/gsis/p3_1.
Schuetze, H. G., and Slowey, M. (2002). Participation and exclusion: A comparative analysis of non-traditional students and lifelong learners in higher education. Higher Education 44, 309-327.
Sugrue, T. J. (1996). The Origins of the Urban Crisis: Race and Inequality in Postwar Detroit. Princeton University Press.
The Ohio State University Kirwan Institute for the Study of Race and Ethnicity. (2015). Understanding Implicit Bias. http://kirwaninstitute.osu.edu/research/understanding-implicit-bias/.
Tilly, C. (1998). Durable Inequality. University of California Press.
Williams, D. A., Berger, J. B. & McClendon, S. A. (2005). Toward a Model of Inclusive Excellence and Change in Postsecondary Institutions. Making Excellence Inclusive initiative sponsored by the AAC&U. Available at: https://www.aacu.org/sites/default/files/files/mei/williams_et_al.pdf.
