14 Chapter 14 – Environmental Justice, Smart Growth and Logic Models, and Health Impact Assessments

Environmental Justice

14.02 Module 14 Discussion Forum Warren County LandfillLink to Blackboard Site

For this discussion, you will be investigating the topic of environmental justice through a discussion on the Warren County, North Carolina Dioxin Landfill case. You will then compose a response to several prompts and share it with your group.

Pre-Discussion Work

To begin this assignment, review the following resources:

  • Environmental Justice Multimedia and materials contained in the Course Textbook under Environmental Justice:

Drafting Your Response

Next, prepare your forum post by creating a Google document. On your document, answer the following questions:

  1. What was the environmental justice issue in this situation?
  2. Did the state initially listen to the concerns of the public?
  3. Do you believe that the response of the officials was appropriate?
  4. Why do you believe the official moved ahead on the project?
  5. Why would EPA waive certain requirements of the landfill design?

Be sure to support your responses by referencing materials from this module. Also, once you have answered the questions, be sure to proofread what you wrote before you share it.

Discussing Your Work

To discuss your findings, follow the steps below:

Step 01. After you have finished writing and proofreading your response, click on the link to your group under the My Groups link in the main menu on the left side of this page.

Step 02. Once in your group, click on the Group Discussion Board link and locate the Module 07 Discussion Forum 2.

Step 03. In the Module 07 Discussion Forum 2, create a new thread and title it using the following format: Yourname’s Dioxin Landfill Post.

Step 04. In the Message field of your post, copy and paste the text of your composition from the Google Document you created– please do not provide a link to that Google Doc.

Step 05. Correct the formatting using the text-editing tools in the Message field. Add bolding, underlining, or italics where necessary. Also, correct any spacing and other formatting issues. Make sure your post looks professional.

Step 06. When you have completed proofreading and fixing your post formatting, click on the Submit button.


The EPA chose this county for a toxic dump because its residents were ‘few, black, and poor’

PCB landfill protest in Afton, North Carolina, September 1982. (Jerome Friar/UNC Libraries)

Looking to skirt costly new environmental laws, the Ward Transformer Company began dumping toxic waste along the shoulders of North Carolina roads in 1978. From June to August, a team of men used the cover of night to spray transformer oil — laced with hazardous chemicals such as dioxin, dibenzofurans, and polychorinated biphenyls (PCBs) — onto the ground, polluting lakes, farmland, and groundwater. In final tally, some 31,000 gallons of transformer oil were dumped, contaminating 60,000 tons of earth along 240 miles of highway.

Ironically, the toxic dumping travesty in Warren County, North Carolina, owed its existence to a separate environmental disaster. The same year Robert Ward and Robert Burns began dumping their waste along the highway, the town of Love Canal, New York made headlines as its citizens fell ill from the toxic landfill beneath their feet. Reacting to the crisis, in August, 1978, President Jimmy Carter declared Love Canal a disaster area, and the EPA moved to prevent a similar catastrophe from happening again.

It was this subsequent regulation — which made toxic waste disposal more expensive — that the surreptitious dumpers were looking to avoid. Robert Burns and his sons released the valves of tanker trucks to spray tens of thousands of gallons of waste along tracts of highway in 14 counties. The oil left dark stripes on the grass, generating the swift attention of law enforcement. The dumpers, as well as company owner Robert Ward, were briefly jailed and fined under the new Toxic Substance Control Act, drafted in the wake of the Love Canal disaster. That same law also stipulated that the soil, contaminated by an abundance of PCBs, had to be put in a landfill.

Where does one put a heap of toxic earth, laced with a chemical reputed to cause birth defects, skin and liver problems, and cancer? The state decided on the politically neglected Warren County, North Carolina— the population of which was 65 percent black. It ranked 97th of 100 for GDP by county statewide. As of the 1970 census, 40 percent of the county’s homes lacked indoor plumbing.

A public hearing on the Warren County landfill was held in January, 1979. Around 800 people attended to protest the dump site, which residents worried would pollute the water and deter new investment in what was an already vulnerable local economy. Governor Jim Hunt’s administration was unfazed, and one official that the construction of the landfill would continue, “regardless of public sentiment.”

Residents and sympathizers opposed the Warren County landfill for nearly four years. They suggested an already active chemical waste site in Emelle, Alabama, but shipping contaminated soil there was estimated to cost $8.8 million. Reverend Joseph Lowry called it “an assault on the life and dignity of the citizens of Warren County.” Organizations and community leaders, including the NAACP and a black Baptist church, mounted a lawsuit against the dump, which they argued chose the town of Afton because its residents were “few, black, and poor.”

‘’These folks believe that they’re fighting for their lives, more so now than ever,’’ said Ken Ferrucio, the president of a 400-member group established to fight the PCB disposal site. ‘’People believe that PCB’s are just the beginning. That’s what frightens them.’’

North Carolina State Troopers pick up protestors on the road to the Warren County Landfill in Afton, North Carolina, September 1982. (AP Photo/Steve Helber)

But the state yielded little. And when a delegation from the community visited Washington to meet with the EPA, where they discovered that the agency was actually working to loosen requirements about a landfill’s proximity to groundwater to enable the dump’s construction. Governor Jim Hunt had also loosened state laws concerning public hearings, which were required to precede major civil projects.

In 1982, the EPA Superfund, headed by Anne Gorsuch Burford (mother of Supreme Court nominee Neil Gorsuch) allocated $2.5 million to create the Warren County landfill.  Workers were to scrape up soil along the roads in three-inch-deep, thirty-inch-wide tracts, turning up enough to fill 10,000 truckloads. In late summer, the project officially began.

Even before the first trucks rolled in the atmosphere was tense. In August, a vandal used a knife to cut a slice into the plastic liner of the dump site. Taking it as a promise of violence, the state assigned 200 patrol officers to the area and put the National Guard on alert.

But protesters were almost entirely peaceful. They marched and held signs asking for the protection of their community. Many lay on the road to prevent the trucks from dispatching their loads of PCB-laden soil. High-profile names, like Walter E. Fauntroy, chairman of the Congressional Black Caucus, were among the protesters taken into police custody. Ken Ferrucino, president of Warren County Citizens Concerned About PCB, was arrested, and staged a 19-day hunger strike in prison. During the six weeks of protest, police arrested over 500 people.

The protest efforts did not stop the landfill’s construction, but they did, in 1982, lead to the election of local black officials, as well as galvanize the cause of environmental injustice. Duke University’s student newspaper called the protest “the largest civil disobedience in the South since Dr. Martin Luther King, Jr., marched through Alabama.” It tied black leaders, especially in the case of the Congressional Black Caucus, to the cause of toxic waste disposal, which almost always affected poor communities, and often impacted African American ones.

Following the impetus set by the Warren County protests, in 1987 the United Church for Christ released a report detailing how minority communities bear the brunt of hazardous chemical sites. It found three out of every five African Americans and Hispanics live in a community housing toxic waste, and confirmed the intuitive conclusion that the government was most likely to dispose of dangerous materials in poor and politically marginalized neighborhoods. As the issue of environmental justice gained traction, in 1994 President Bill Clinton signed an executive order requiring the federal government to account for the harm posed to minority communities by new hazmat disposal sites. With Warren County, environmentalism became not just about whales, or acid rain, or holes in the ozone, but also about people protecting their own homes.[1]

Warren County v. North Carolina

No. 79-560-CIV-5 (528 F. Supp. 276, 16 ERC 2047) (E.D.N.C. November 5, 1981)

The court rejects Warren County, North Carolina’s federal and state law challenges to decisions of the state to use, and of the Environmental Protection Agency (EPA) to approve the sue of, a parcel of land in the county as a disposal site for soil contaminated with polychlorinated biphenyls (PCBs). The court first finds that although the county has a sufficient “personal stake” in the matter to have standing, its interests are not all within the “zones protected” by the applicable statutes. It may not assert the claim that the disposal site is a public nuisance, because the applicable North Carolina statute requires that such actions be brought by local health officers. The county is also not a citizen within the meaning of the Toxic Substances Control Act’s (TSCA’s) citizen suit provision, because its powers are derivative and not based on inherent sovereign authority. On the other hand, the county has standing to bring challenges under both the National Environmental Policy Act (NEPA) and the North Carolina Environmental Policy Act (NCEPA), both of which address environmental risks of the type alleged. The county also has standing for its claim that the state action violates the state Administrative Procedure Act. In addition, it is the logical party to seek enforcement of the county ordinance prohibiting PCB disposal within its borders. Finally, the court concludes that on the basis of case law under NEPA and in the absence of cases establishing a test under state law, that the county has standing to challenge the adequacy of the environmental impact statement (EIS) prepared under the NCEPA because of the potential loss of tax revenue and damage to the county’s environment. The court next turns to the subtantive claims, including those with respect to which plaintiff lacks standing. It first states that North Carolina’s use of its property in a manner authorized by valid statute may not be enjoined as a public nuisance. Next, it holds that EPA’s failure to prepare an EIS before approving the site did not violate NEPA, because the procedures it followed in approving the site under TSCA are the functional equivalent of EIS procedures. Nor was EPA’s approval of the site arbitrary and capricious, because the administrative record reveals a rational basis for the decision. The court then rules that the Warren County ordinance banning PCB disposal is implicitly preempted by TSCA because it conflicts with the objectives of the federal statute and its effect is to frustrate totally Congress’ scheme for ensuring safe disposal of PCBs. Finally, the court rules that the EIS prepared by the state under the NCEPA is not defective. Applying the NEPA “rule of reason” standard of review in the absence of applicable state case law, the court finds that the EIS adequately describes the project and that the state considered all reasonable alternatives presented and all the potential environmental consequences which were not extremely unlikely. It grants defendants’ motion for summary judgment on all claims.[2]

14.07 Assignment – Donating to Global Sustainability Goal

    -Link to Blackboard Site

In this assignment you will be looking at the United Nations Sustainability Goals.  You will assume that a relative who is a philanthropist has asked you to help with donating $750,000.   The specifics of the help needed are as follows:

1. You will select which three of the goals that you would recommend and state why you believe monies should be given to accomplish the goal.

2. Indicate how much you would give to each project.

3. You will indicate one goal that you would not wish to support and why you do not believe monies should be given to attain that particular goal

4. What are three criteria that you would use to select a Non-governmental Organization (NGO) to be the recipient for the funds.  (Note-this is a general recommendation on NGO operations and not a specific NGO.

5. For one of the goals you would support list one specific NGO that you would provide funds to for accomplishing the goal.

Download the Worksheet for completion of this assignment
Module 14 -14.07 Assignment Worksheet – Donating to Global Sustainability Goal.docx


Writing Your Essay

Write your original responses on the Module 04 Assignment Worksheet. When you write your essay, be sure to address the requirements as described in the worksheet directions. Submitting Your Worksheet
To submit your Module 14 Assignment Worksheet, click on the assignment link below. Then, click on the Browse My Computer button and locate and select your completed Module 02 Assignment Worksheet to attach it to your assignment. Once your worksheet is attached, submit your assignment.


United Nation’s Sustainability Goals[3]

The Sustainable Development Goals are the blueprint to achieve a better and more sustainable future for all. They address the global challenges we face, including poverty, inequality, climate change, environmental degradation, peace and justice. Learn more and take action.

Goal 1: End poverty in all its forms everywhere

Eradicating extreme poverty for all people everywhere by 2030 is a pivotal goal of the 2030 Agenda for Sustainable Development. Between 2015 and 2018, global poverty continued its historical decline, with the poverty rate falling from 10.1 per cent in 2015 to 8.6 per cent in 2018. Nowcasts suggest that owing to the COVID-19 pandemic, the global poverty rate increased sharply from 8.3 per cent in 2019 to 9.2 per cent in 2020, representing the first increase in extreme poverty since 1998 and the largest increase since 1990 and setting back poverty reduction by about three years.

The impact of the COVID-19 pandemic reversed the steady progress of poverty reduction over the past 25 years. This unprecedented reversal is being further exacerbated by rising inflation and the impacts of the war in Ukraine. It is estimated that these combined crises will lead to an additional 75 million–95 million people living in extreme poverty in 2022, compared with pre-pandemic projections.

  • Between 2015 and 2018, global poverty continued its historical decline, with the global poverty rate falling from 10.1 per cent in 2015 to 8.6 per cent in 2018.
  • Owing to the COVID-19 pandemic, the global poverty rate increased sharply from 8.3 per cent in 2019 to 9.2 per cent in 2020, rewinding progress by about three years.
  • This unprecedented reversal is being further exacerbated by rising inflation and the impacts of the war in Ukraine. It is estimated that these combined crises will lead to an additional 75–95 million people living in extreme poverty in 2022, compared with pre-pandemic projections.
  • The losses have been much higher for low-income countries, where poverty reduction has been set back by between eight and nine years. Although the poverty rate is projected to decrease to 8.7 per cent in 2021, it was still higher than the pre-pandemic level.
  • For the first time in two decades, the world’s share of workers living with their families below the international poverty line increased from 6.7 per cent in 2019 to 7.2 per cent in 2020, meaning that an additional 8 million workers were pushed into poverty.

Goal 2: Zero Hunger

Sustainable Development Goal 2 is about creating a world free of hunger by 2030.  In 2020, between 720 million and 811 million persons worldwide were suffering from hunger, roughly 161 million more than in 2019. Also in 2020, a staggering 2.4 billion people, or above 30 per cent of the world’s population, were moderately or severely food-insecure, lacking regular access to adequate food. The figure increased by nearly 320 million people in just one year. Globally, 149.2 million children under 5 years of age, or 22.0 per cent, were suffering from stunting (low height for their age) in 2020, a decrease from 24.4 per cent in 2015.

The number of people going hungry and suffering from food insecurity had been gradually rising between 2014 and the onset of the COVID-19 pandemic. The COVID-19 crisis has pushed those rising rates even higher and has also exacerbated all forms of malnutrition, particularly in children. The war in Ukraine is further disrupting global food supply chains and creating the biggest global food crisis since the Second World War.

Photo: Two and a half million people in the Central African Republic (CAR) are facing hunger.
  • In 2020, between 720 million and 811 million persons worldwide were suffering from hunger, roughly 161 million more than in 2019.
  • Also in 2020, a staggering 2.4 billion people, or above 30 per cent of the world’s population, were moderately or severely food-insecure, lacking regular access to adequate food.
  • Globally, 149.2 million children under 5 years of age, or 22.0 per cent, were suffering from stunting (low height for their age) in 2020, down from 24.4 per cent in 2015.
  • To achieve the target of a 5 per cent reduction in the number of stunted children by 2025, the current rate of yearly decline – 2.1 per cent – must double to 3.9 per cent.
  • In 2020, wasting (low weight for height) affected 45.4 million or 6.7 per cent of children under 5 years of age.
  • The share of countries burdened by high food prices, which had been relatively stable since 2016, rose sharply from 16 per cent in 2019 to 47 per cent in 2020.

Goal 3: Ensure healthy lives and promote well-being for all at all ages

Ensuring healthy lives and promoting well-being at all ages is essential to sustainable development. The COVID-19 pandemic continues to spread human suffering.

As of mid-2022, COVID-19 had infected more than 500 million people worldwide. The latest estimates show that global “excess deaths” directly and indirectly attributable to COVID-19 could have been as high as 15 million by the end of 2021.

The pandemic has severely disrupted essential health services, triggered an increase in the prevalence of anxiety and depression, lowered global life expectancy, derailed progress towards ending HIV, tuberculosis (TB) and malaria, and halted two decades of work towards making health coverage universal.

As a result, immunization coverage dropped for the first time in 10 years, and deaths from TB and malaria increased. Urgent and concerted action is needed to set the world back on a trajectory towards achieving Goal 3.

  • In 2020 and 2021, 14.9 million people were estimated to have died due to COVID-19 and its impact on health systems and society.
  • Interruptions in essential health services were reported in 92 per cent of 129 countries surveyed at the end of 2021.
  • As of May 2022, more than 80 per cent of people had received at least one dose of a vaccine in high-income countries but the proportion is only about 17 per cent in low-income countries.
  • Between January 2020 and May 2021, the pandemic may have claimed the lives of 115,500 health and care workers worldwide.
  • In 2020, the global prevalence of anxiety and depression increased by an estimated 25 per cent, with young people and women most affected.
  • In 2015–2021, an estimated 84 per cent of births were assisted by skilled health professionals, an increase from 77 per cent in 2008–2014.
  • The global mortality rate of children under age 5 fell by 14 per cent from 2015 to 2020.
  • 5 million children died before reaching their fifth birthday in 2020 alone, down from 5.9 million in 2015.
  • From 2010 to 2020, the adolescent birth rate dropped from 47.9 births to 41.2 births per 1,000 adolescents aged 15 to 19.
  • The universal health coverage improved from a global average of 45 out of 100 in 2000 to 64 in 2015 and then 67 in 2019.
  • In 2020, an estimated 1.5 million people were newly diagnosed with HIV and 680,000 people died of AIDS-related causes.
  • The incidence of HIV infections globally declined by 39 per cent between 2010 and 2020, far less than the 75 per cent target agreed to by the General Assembly in 2016.
  • TB deaths increased from 1.2 million in 2019 to 1.3 million in 2020 due to disruptions associated with the pandemic.
  • Between 2018 and 2020, TB treatment reached 20 million people, only half of the global target.
  • In 2020, 627,000 people died from malaria, with cases estimated to have reached 241 million.
  • About two thirds of the additional deaths were linked to disruptions in the provision of malaria services during the pandemic.
  • The number of people requiring neglected tropical diseases (NTD) treatment and care declined from 2.19 billion in 2010 to 1.73 billion in 2020.
  • By the end of 2020, at least one NTD had been eliminated in 42 countries.
  • From 2019 to 2020, coverage of infant immunization slipped from 86 per cent to 83 per cent.
  • 7 million children missed out on vaccinations in 2020, 3.7 million more than in 2019 and the highest number since 2005.
  • 1 million older children did not receive vaccines through the routine immunization programme in 2020, an increase from 13.6 million in 2019.

Goal 4: Quality Education

Providing quality education for all is fundamental to creating a peaceful and prosperous world. Education gives people the knowledge and skills they need to stay healthy, get jobs and foster tolerance.

The COVID-19 outbreak, however, has caused a global education crisis. Most education systems in the world have been severely affected by education disruptions and have faced unprecedented challenges. School closures brought on by the pandemic have had devastating consequences for children’s learning and well-being.

It is estimated that 147 million children missed more than half of their in-class instruction over the past two years. This generation of children could lose a combined total of $17 trillion in lifetime earnings in present value.

School closures have affected girls, children from disadvantaged backgrounds, those living in rural areas, children with disabilities and children from ethnic minorities more than their peers.

  • 147 million children are estimated to have missed more than half of their in-class instruction over the past two years due to school closures caused by the COVID-19 pandemic. This generation of children could lose a combined total of $17 trillion in lifetime earnings in present value.
  • The proportion of young people completing upper secondary school increased from 54 per cent in 2015 to 58 per cent in 2020, with progress slowing from the preceding five-year period.
  • Data from 73 countries, mostly in the low- and middle-income bracket, indicate that between 2013 and 2021, about 7 in 10 children who were 3 and 4 years old are developmentally on track.
  • The participation rate in organized pre-school learning rose steadily in the years before the COVID-19 pandemic, from 69 per cent in 2010 to 75 per cent in 2020 but with considerable variation between countries.
  • Only 20 per cent of countries undertook significant measures to provide additional mental health and psychosocial support for students after school reopening.
  • Most countries have not achieved gender parity in the proportion of children meeting minimum learning proficiency standards in reading, and in the lower secondary completion rate.
  • In 2020, about one quarter of primary schools globally did not have access to basic services such as electricity, drinking water and basic sanitation facilities. Roughly 50 per cent of primary schools had access to facilities such as information and communications technology and disability-adapted infrastructure.
  • In 2020, there were about 12 million pre-primary schoolteachers, 33 million primary school teachers and 38 million secondary school teachers working in classrooms around the world, and 83 per cent of primary and secondary school teachers were trained.

Goal 5: Achieve gender equality and empower all women and girls

Gender equality is not only a fundamental human right, but a necessary foundation for a peaceful, prosperous and sustainable world. There has been progress over the last decades, but the world is not on track to achieve gender equality by 2030.

The social and economic fallout from the COVID-19 pandemic has made the situation even bleaker. Progress in many areas, including time spent on unpaid care and domestic work, decision-making regarding sexual and reproductive health, and gender-responsive budgeting, is falling behind.

Women’s health services, already poorly funded, have faced major disruptions. Violence against women remains endemic. And despite women’s leadership in responding to COVID-19, they still trail men in securing the decision-making positions they deserve.

Commitment and bold action are needed to accelerate progress, including through the promotion of laws, policies, budgets and institutions that advance gender equality. Greater investment in gender statistics is vital, since less than half of the data required to monitor Goal 5 are currently available.

  • Globally, 26 per cent of ever-partnered women aged 15 and older (641 million) have been subjected to physical and/or sexual violence by a husband or intimate partner at least once in their lifetime.
  • In a 2021 survey in 13 countries, 45 per cent of women reported that they or a woman they know has experienced some form of violence since COVID-19.
  • In 2021, nearly one in five young women were married before the age of 18.
  • 35 per cent and 28 per cent of young women were married in childhood, respectively in sub-Saharan Africa and Southern Asia,
  • The global prevalence of child marriage has declined by about 10 per cent in the past five years.
  • Up to 10 million more girls are likely to become child brides by 2030 due to the effects of the COVID-19 pandemic, in addition to the 100 million girls projected to be at risk before the pandemic.
  • At least 200 million girls and women today have been subjected to female genital mutilation, mainly in 31 countries.
  • As of 1 January 2022, the global share of women in lower and single houses of national parliaments reached 26.2 per cent, up from 22.4 per cent in 2015.
  • At this pace, it would take another 40 years for women and men to be represented equally in national parliaments.
  • Women’s share is slightly over one third in local governments.
  • In 2019, before the pandemic, women accounted for 39.4 per cent of total employment. In 2020, women represented nearly 45 per cent of global employment losses.
  • The share of women in managerial positions worldwide increased from 27.2 to 28.3 per cent from 2015 to 2019, but remained unchanged from 2019 to 2020, the first year without an increase since 2013.
  • Between 2007 and 2021, 57 per cent of women aged 15 to 49 who are married or in a union made their own informed decisions regarding sexual relations, contraceptive use and reproductive health care.
  • In the first year of the pandemic, an estimated 1.4 million additional unintended pregnancies occurred in lower- and middle-income countries.
  • Only 15 out of 52 reporting countries included sufficient provisions in their legal frameworks to protect women’s rights to land.
  • Between 2018 and 2021, only 26 per cent of countries have comprehensive systems in place to track public allocations for gender equality, 59 per cent have some features of such a system, and 15 per cent do not have the minimum elements of such a system.

Goal 6: Ensure access to water and sanitation for all

Access to safe water, sanitation and hygiene is the most basic human need for health and well-being. Billions of people will lack access to these basic services in 2030 unless progress quadruples. Demand for water is rising owing to rapid population growth, urbanization and increasing water needs from agriculture, industry, and energy sectors.

Decades of misuse, poor management, overreaction of groundwater and contamination of freshwater supplies have exacerbated water stress. In addition, countries are facing growing challenges linked to degraded water-related ecosystems, water scarcity caused by climate change, under-investment in water and sanitation and insufficient cooperation on transboundary waters.

To reach universal access to drinking water, sanitation and hygiene by 2030, the current rates of progress would need to increase fourfold. Achieving these targets would save 829,000 people annually, who die from diseases directly attributable to unsafe water, inadequate sanitation and poor hygiene practices.

  • In 2020, 74 per cent of the global population had access to safely managed drinking water services, up from 70 per cent in 2015. Still, two billion people live without safely managed drinking water services, including 1.2 billion people lacking even a basic level of service, in 2020.
  • Between 2015 and 2020, the population with safely managed sanitation increased from 47 per cent to 54 per cent and the population with access to handwashing facilities with soap and water in the home increased from 67 per cent to 71 per cent. Rates of progress for these basic services would need to quadruple for universal coverage to be reached by 2030.
  • At the current rates of progress, 1.6 billion people will lack safely managed drinking water, 2.8 billion people will lack safely managed sanitation, and 1.9 billion people will lack basic hand hygiene facilities in 2030.
  • Eight out of 10 people who lack even basic drinking water service live in rural areas, and about half of them live in least developed countries (LDCs).
  • Water use efficiency worldwide rose from $17.4 per cubic metre in 2015 to $19.4 per cubic metre in 2019, a 12 per cent efficiency increase.
  • Assessment of rivers, lakes and aquifers in 97 countries in 2020 shows that 60 per cent of water bodies have good water quality. For at least 3 billion people, the quality of the water they rely upon is unknown owing to a lack of monitoring.
  • From 2015 to 2020, the population practising open defecation decreased by a third, from 739 million people to 494 million. The world is on track to eliminate open defecation by 2030.
  • Over the past 300 years, over 85 per cent of the planet’s wetlands have been lost, mainly through drainage and land conversion, with many remaining wetland areas degraded. Since 1970, 81 per cent of species dependent on inland wetlands have declined faster than those relying on other biomes, and an increasing number of these species are facing extinction.
  • Across the world, water stress levels remained safe at 18.6 per cent in 2019. However, Southern Asia and Central Asia registered high levels of water stress at over 75 per cent, whereas Northern Africa registered a critical water stress level of over 100 per cent. Since 2015, water stress levels have increased significantly in Western Asia and Northern Africa.
  • Data from 2017 and 2020 suggest only 32 countries have 90 per cent or more of their transboundary waters covered by cross-border cooperative arrangements.

Goal 7: Ensure access to affordable, reliable, sustainable and modern energy

Goal 7 is about ensuring access to clean and affordable energy, which is key to the development of agriculture, business, communications, education, healthcare and transportation. The lack of access to energy hinders economic and human development.

Latest data suggest that the world continues to advance towards sustainable energy targets. Nevertheless, the current pace of progress is insufficient to achieve Goal 7 by 2030. Huge disparities in access to modern sustainable energy persist.

Rising commodity, energy and shipping prices have increased the cost of producing and transporting solar photovoltaics modules, wind turbines and biofuels worldwide, adding uncertainty to a development trajectory that is already far below Goal 7 ambitions. Achieving energy and climate goals will require continued policy support and a massive mobilization of public and private capital for clean and renewable energy, especially in developing countries.

  • The global electricity access rate increased from 83 per cent in 2010 to 91 per cent in 2020. Over this period, the number of people without electricity shrank from 1.2 billion to 733 million.
  • From 2018 to 2020, the electricity access rate rose by an average of 0.5 percentage points annually, compared to 0.8 percentage points between 2010 and 2018.
  • At the current pace, only 92 per cent of the world’s population would have access to electricity in 2030, leaving 670 million people unserved.
  • Due to economic pressures imposed by the COVID-19 pandemic, up to 90 million people connected to electricity in Africa and developing countries in Asia could not afford to have an extended bundle of services in 2020.
  • Between 2010 and 2020, the proportion of people with access to clean cooking fuels and technologies increased from 57 per cent to 69 per cent.
  • 4 billion people still relied on inefficient and polluting cooking systems in 2020.
  • The share of renewables in total final energy consumption reached 17.7 per cent in 2019, 1.6 percentage points higher than in 2010.
  • Global primary energy intensity (energy efficiency) improved from 5.6 megajoules per US dollar in 2010 to 4.7 in 2019, with an average annual improvement rate of 1.9 per cent.
  • To meet energy efficiency target, the annual rate of improvement until 2030 will need to average 3.2 per cent a year.
  • International public financial flows to developing countries in support of clean energy amounted to $10.9 billion in 2019, down by nearly 24 per cent from the previous year.
  • The five-year moving average also decreased for the first time since 2008, from $17.5 billion for 2014–2018 to $16.6 billion for 2015–2019.
  • Loans accounted for over 52 per cent of commitments in 2019. Grants comprised almost 17 per cent. Shares in collective investment vehicles grew to $191 million in 2019, up by 91 per cent from 2018.

Goal 8: Promote inclusive and sustainable economic growth, employment and decent work for all

Sustained and inclusive economic growth can drive progress, create decent jobs for all and improve living standards.

COVID-19 has disrupted billions of lives and endangered the global economy. The International Monetary Fund (IMF) expects a global recession as bad as or worse than in 2009. As job losses escalate, the International Labor Organization estimates that nearly half of the global workforce is at risk of losing their livelihoods.

Even before the outbreak of COVID-19, one in five countries – home to billions of people living in poverty – were likely to see per capita incomes stagnate or decline in 2020. Now, the economic and financial shocks associated with COVID-19—such as disruptions to industrial production, falling commodity prices, financial market volatility, and rising insecurity—are derailing the already tepid economic growth and compounding heightened risks from other factors.

  • The global unemployment rate in 2017 was 5.6per cent, down from 6.4per cent in 2000.
  • Globally, 61per cent of all workers were engaged in informal employment in 2016. Excluding the agricultural sector, 51per cent of all workers fell into this employment category.
  • Men earn 12.5per cent more than women in 40 out of 45 countries with data.
  • The global gender pay gap stands at 23 per cent globally and without decisive action, it will take another 68 years to achieve equal pay. Women’s labor force participation rate is 63 per cent while that of men is 94 per cent.
  • Despite their increasing presence in public life, women continue to do 2.6 times the unpaid care and domestic work that men do.

Goal 9: Build resilient infrastructure, promote sustainable industrialization and foster innovation

Inclusive and sustainable industrialization, together with innovation and infrastructure, can unleash dynamic and competitive economic forces that generate employment and income. They play a key role in introducing and promoting new technologies, facilitating international trade and enabling the efficient use of resources.

However, the world still has a long way to go to fully tap this potential. Least developed countries, in particular, need to accelerate the development of their manufacturing sector if they are to meet the 2030 target, and scale up investment in scientific research and innovation.

Global manufacturing growth has been steadily declining, even before the outbreak of the COVID-19 pandemic. The pandemic is hitting manufacturing industries hard and causing disruptions in global value chains and the supply of products.

Innovation and technological progress are key to finding lasting solutions to both economic and environmental challenges, such as increased resource and energy-efficiency. Globally, investment in research and development (R&D) as a proportion of GDP increased from 1.5 per cent in 2000 to 1.7 per cent in 2015 and remained almost unchanged in 2017, but was only less than 1 per cent  in developing regions.

In terms of communications infrastructure, more than half of the world’s population is now online and almost the entire world population lives in an area covered by a mobile network. It is estimated that in 2019, 96.5 per cent were covered by at least a 2G network.

The coronavirus pandemic has revealed the urgent need for resilient infrastructure. The Asian Development Bank notes that critical infrastructure in the region remains far from adequate in many countries, despite the rapid economic growth and development the region has experienced over the past decade. The Economic and Social Survey of Asia and the Pacific highlights that making infrastructure resilient to disasters and climate change will require an additional investment of $434 billion per year. This sum may need to be even greater in some subregions, such as the Pacific small island developing states.

  • In 2018, 96 per cent of the world’s population lived within reach of a mobile-cellular signal, and 90 per cent of people could access the Internet through a third generation (3G) or higher-quality network.
  • 16 per cent of the global population does not have access to mobile broadband networks.
  • The global share of manufacturing value added in GDP increased from 15.2per cent in 2005 to 16.3per cent in 2017, driven by the fast growth of manufacturing in Asia.
  • Least developed countries have immense potential for industrialization in food and beverages (agro-industry), and textiles and garments, with good prospects for sustained employment generation and higher productivity
  •  In 2019, the amount of new renewable power capacity added (excluding large hydro) was the highest ever, at 184 gigawatts, 20GW more than in 2018. This included 118GW of new solar systems, and 61GW of wind turbines.
  • Capacity investment in solar slipped 3per cent to $131.1 billion in 2019, while that in wind climbed 6per cent to $138.2 billion – the first time that wind has outweighed solar in terms of dollars committed since 2010.
  • Developing countries continued to outpace developed economies in renewables investment. In 2019, they committed $152.2 billion, compared to $130 billion for developed countries.

Goal 10: Reduce inequality within and among countries

Reducing inequalities and ensuring no one is left behind are integral to achieving the Sustainable Development Goals. Inequality within and among countries is a persistent cause for concern.

The effects of the COVID-19 pandemic appear to be reversing any positive trends of narrowing income inequality. The pandemic has also intensified structural and systemic discrimination. Emerging markets and developing economies are experiencing slow recoveries, widening disparities in income between countries. The number of refugees and migrant deaths worldwide reached the highest absolute number on record in 2021.

Meanwhile, the war in Ukraine rages on, forcing even more people from their homes and creating one of the largest refugee crises in recent memory.

  • Projections suggest that between-country inequality rose by 1.2 per cent between 2017 and 2021, the first such increase in a generation. Before the pandemic, inequality was expected to have fallen by 2.6 per cent over the same period.
  • Income inequality within countries will also have increased around 1 per cent, on average, in emerging market and developing countries, halting the steady decline seen in these countries since the start of the millennium.
  • Roughly one in five people have experienced discrimination on at least one of the grounds prohibited under international human rights law, such as ethnicity, age, sex, disability, religion and sexual orientation.
  • In some countries, women are more than twice as likely as men to experience discrimination on the grounds of sex. One third of persons with disabilities experience discrimination.
  • A decline in the labor share of income from 2014 to 2019 ‐ from 54.1 per cent to 52.6 per cent ‐ represents upward pressure on inequality.
  • By mid-2021, the number of people forced to flee their countries had grown to a record high 24.5 million. For every 100,000 people worldwide, 311 are refugees outside their country of origin, up 44 per cent from 216 per 100,000 people in 2015.
  • Countries in Northern Africa and Western Asia were the largest regional source of refugees (8.4 million), followed by countries in sub-Saharan Africa (6.7 million), and Latin America and the Caribbean (4.5 million).
        • alf of humanity – 3.5 billion people – lives in cities today and 5 billion people are projected to live in cities by 2030.
        • 95 per cent of urban expansion in the next decades will take place in developing world
        • 828 million people live in slums today and most them are found in Eastern and South-Eastern Asia.
        • The world’s cities occupy just 3 per cent of the Earth’s land, but account for 60-80 per cent of energy consumption and 75 per cent of carbon emissions.
        • Rapid urbanization is exerting pressure on fresh water supplies, sewage, the living environment, and public health.
        • Cities account for between 60 and 80 per cent of energy consumption and generate as much as 70per cent of human-induced greenhouse gas emissions
        • 90 per cent of urban growth is forecasted to happen in Asia and Africa in the next 30 years.
        • By 2050 70 per cent of the world population is predicted to live in urban settlements.

        Goal 12: Ensure sustainable consumption and production patterns


         Worldwide consumption and production — a driving force of the global economy — rest on the use of the natural environment and resources in a way that continues to have destructive impacts on the planet.


        Economic and social progress over the last century has been accompanied by environmental degradation that is endangering the very systems on which our future development — indeed, our very survival — depends.

        A few facts and figures:

        • Each year, an estimated one third of all food produced – equivalent to 1.3 billion tonnes worth around $1 trillion – ends up rotting in the bins of consumers and retailers, or spoiling due to poor transportation and harvesting practices.
        • If people worldwide switched to energy efficient light bulbs the world would save US$120 billion annually.
        • Should the global population reach 9.6 billion by 2050, the equivalent of almost three planets could be required to provide the natural resources needed to sustain current lifestyles.

        The COVID-19 pandemic offers countries an opportunity to build recovery plans that will reverse current trends and change our consumption and production patterns towards a more sustainable future.

        Sustainable consumption and production is about doing more and better with less. It is also about decoupling economic growth from environmental degradation, increasing resource efficiency and promoting sustainable lifestyles.

        Sustainable consumption and production can also contribute substantially to poverty alleviation and the transition towards low-carbon and green economies.

        • According to latest projections, the global population could grow to around 8.5 billion in 2030, 9.7 billion in 2050. The equivalent of almost three planets could be required to provide the natural resources needed to sustain current lifestyles.
        • 93 per cent of the world’s 250 largest companies are now reporting on sustainability.

        Water

        • Less than 3 per cent of the world’s water is fresh (drinkable), of which 2.5 per cent is frozen in the Antarctica, Arctic and glaciers. Humanity must therefore rely on 0.5 per cent for all of man’s ecosystem’s and freshwater needs.
        • Humankind is polluting water in rivers and lakes faster than nature can recycle and purify
        • More than 1 billion people still do not have access to fresh water.
        • Excessive use of water contributes to the global water stress.
        • Water is free from nature, but the infrastructure needed to deliver it is expensive.
        • Water use has been increasing worldwide by about 1per cent per year since the 1980s.
        • Agriculture (including irrigation, livestock and aquaculture) is by far the largest water consumer, accounting for 69per cent of annual water withdrawals globally. Industry (including power generation) accounts for 19per cent and households for 12per cent.
        • Over 2 billion people live in countries experiencing high water stress.
        • Over the period 1995–2015, floods accounted for 43per cent of all documented natural disasters, affecting 2.3 billion people, killing 157,000 more and causing US$662 billion in damage.
        • Three out of ten people (2.1 billion people, or 29per cent of the global population) did not use a safely managed drinking water service4 in 2015, whereas 844 million people still lacked even a basic drinking water service.

        Energy

        • If people worldwide switched to energy efficient light bulbs, the world would save US$120 billion annually.
        • Despite technological advances that have promoted energy efficiency gains, energy use in OECD countries will continue to grow another 35 per cent by 2020. Commercial and residential energy use is the second most rapidly growing area of global energy use after transport.
        • In 2002 the motor vehicle stock in OECD countries was 550 million vehicles (75 per cent of which were personal cars). A 32 per cent increase in vehicle ownership is expected by 2020. At the same time, motor vehicle kilometers are projected to increase by 40 per cent and global air travel is projected to triple in the same period.
        • Households consume 29 per cent of global energy and consequently contribute to 21 per cent of resultant CO2 emissions.
        • The share of renewable energy in final energy consumption has reached 17.5per cent in 2015.
        • The global electrification rate reached 89per cent in 2017 (from 83per cent in 2010), still leaving about 840 million people without access
        • Between 2010 and 2017, the percentage of the population relying on clean cooking solutions grew by an annual average of 0.5 percentage points.
        • The global population without access to electricity fell from 1.2 billion in 2010 to 840 million in 2017.

        Food

        • Each year, an estimated 1/3 of all food produced – equivalent to 1.3 billion tons worth around $1 trillion – ends up rotting in the bins of consumers and retailers, or spoiling due to poor transportation and harvesting practices
        • 38 million children under the age of 5 were overweight or obese in 2019.
        • Land degradation, declining soil fertility, unsustainable water use, over fishing and marine environment degradation are all lessening the ability of the natural resource base to supply food.
        • The food sector accounts for around 30 per cent of the world’s total energy consumption and accounts for around 22 per cent of total Greenhouse Gas emissions.

        Goal 13: Take urgent action to combat climate change and its impacts


         The global temperature has already risen 1.1ºC above the pre-industrial level, with glaciers melting and the sea level rising.  Impacts of climate change also includes flooding and drought, displacing millions of people, sinking them into poverty and hunger, denying them access to basic services, such as health and education, expanding inequalities, stifling economic growth and even causing conflict.   By 2030, an estimated 700 million people will be at risk of displacement by drought alone.

        Taking urgent action to combat climate change and its devastating impacts is therefore an imperative to save lives and livelihood, and key to making the 2030 Agenda for Sustainable Development and its 17 Goals – the blueprint for a better future – a reality.

        In 2020, concentrations of global greenhouse gases reached new highs, and real-time data point to continued increases. As these concentrations rise, so does the Earth’s temperature. In 2021, the global mean temperature was about 1.1°C above the pre-industrial level (from 1850 to 1900). The years from 2015 to 2021 were the seven warmest on record.

        To limit warming to 1.5° Celsius above pre-industrial levels, as set out in the Paris Agreement, global greenhouse gas emissions will need to peak before 2025. Then they must decline by 43 per cent by 2030 and to net zero by 2050. Countries are articulating climate action plans to cut emissions and adapt to climate impacts through nationally determined contributions. However, current national commitments are not sufficient to meet the 1.5°C target.

        • In 2021, the global mean temperature was about 1.1°C above the pre-industrial level (from 1850 to 1900). The years from 2015 to 2021 were the seven warmest on record.
        • The global annual mean temperature is projected to rise beyond 1.5°C above pre-industrial levels in at least one of the next five years.
        • Global carbon dioxide (CO2) emissions declined by 5.2 per cent in 2020 due to lowered energy demand caused by COVID-19-induced social and economic disruptions. But with the phasing out of COVID-related restrictions, energy-related CO2 emissions for 2021 rose by 6 per cent, reaching their highest level ever.
        • Climate finance provided and mobilized by developed countries totalled $79.6 billion in 2019, up from $78.3 billion in 2018. It is estimated that $1.6 trillion to $3.8 trillion will be needed each year through 2050 for the world to transition to a low-carbon future and avoid warming exceeding 1.5 °
        • About one third of global land areas will suffer at least moderate drought by 2100.
        • The sea level could rise 30 to 60 centimetres by 2100, even if greenhouse gas emissions are sharply reduced and global warming is limited to well below 2°C.
        • About 70 to 90 per cent of warm-water coral reefs will disappear even if the 1.5°C threshold is reached; they would die off completely at the 2°C level.
        • 3 billion to 3.6 billion people live in contexts that are highly vulnerable to climate change.
        • By 2030, an estimated 700 million people will be at risk of displacement by drought along. 

        Goal 14: Conserve and sustainably use the oceans, seas and marine resources


        The ocean drives global systems that make the Earth habitable for humankind. Our rainwater, drinking water, weather, climate, coastlines, much of our food, and even the oxygen in the air we breathe, are all ultimately provided and regulated by the sea.

        Careful management of this essential global resource is a key feature of a sustainable future. However, at the current time, there is a continuous deterioration of coastal waters owing to pollution, and ocean acidification is having an adversarial effect on the functioning of ecosystems and biodiversity. This is also negatively impacting small scale fisheries.

        Saving our ocean must remain a priority. Marine biodiversity is critical to the health of people and our planet. Marine protected areas need to be effectively managed and well-resourced and regulations need to be put in place to reduce over fishing, marine pollution and ocean acidification.

        Climate change

        • Oceans absorb about 30 per cent of carbon dioxide produced by humans, buffering the impacts of global warming.
        • Carbon emissions from human activities are causing ocean warming, acidification and oxygen loss.
        • The ocean has also absorbed more than 90per cent of the excess heat in the climate system.
        • Ocean heat is at record levels, causing widespread marine heatwaves.

        Ocean and people

        • Over three billion people depend on marine and coastal biodiversity for their livelihoods.
        • Globally, the market value of marine and coastal resources and industries is estimated at $3 trillion per year or about 5 per cent of global GDP.
        • Marine fisheries directly or indirectly employ over 200 million people.
        • Coastal waters are deteriorating due to pollution and eutrophication. Without concerted efforts, coastal eutrophication is expected to increase in 20 percent of large marine ecosystems by 2050.
        • Roughly 80per cent of marine and coastal pollution originates on land – including agricultural run-off, pesticides, plastics and untreated sewage.
        • Around the world, one million plastic drinking bottles are purchased every minute, while up to 5 trillion single-use plastic bags are used worldwide every year
        • Around 680 million people live in low-lying coastal zones – that is expected to increase to a billion by 2050.
        • Sustainable and climate-resilient transport, including maritime transport, is key to sustainable development. Around 80 per cent of the volume of international trade in goods is carried by sea, and the percentage is even higher for most developing countries

        Goal 15: Life on Land

        Nature is critical to our survival: nature provides us with our oxygen, regulates our weather patterns, pollinates our crops, produces our food, feed and fiber. But it is under increasing stress. Human activity has altered almost 75 per cent of the earth’s surface, squeezing wildlife and nature into an ever-smaller corner of the planet.

        Around 1 million animal and plant species are threatened with extinction – many within decades – according to the 2019 Global Assessment Report on Biodiversity and Ecosystem Service. The report called for transformative changes to restore and protect nature. It found that the health of ecosystems on which we and all other species depend is deteriorating more rapidly than ever, affecting  the very foundations of our economies, livelihoods, food security, health and quality of life worldwide.

        Deforestation and desertification – caused by human activities and climate change – pose major challenges to sustainable development and have affected the lives and livelihoods of millions of people. Forests are vitally important for sustaining life on Earth, and play a major role in the fight against climate change. And investing in land restoration is critical for improving livelihoods, reducing vulnerabilities, and reducing risks for the economy.

        The health of our planet also plays an important role in the emergence of zoonotic diseases, i.e. diseases that are transmissible between animals and humans. As we continue to encroach on fragile ecosystems, we bring humans into ever-greater contact with wildlife, enabling pathogens in wildlife to spill over to livestock and humans, increasing the risk of disease emergence and amplification.

        • Human activity has altered almost 75 per cent of the earth’s surface, squeezing wildlife and nature into an ever-smaller corner of the planet and increasing risks of zoonotic diseases like COVID-19.

        Forests

        • Around 1.6 billion people depend on forests for their livelihood, including 70 million indigenous people.
        • Forests are home to more than 80 per cent of all terrestrial species of animals, plants and insects.
        • Between 2010 and 2015, the world lost 3.3 million hectares of forest areas. Poor rural women depend on common pool resources and are especially affected by their depletion.
        • Currently, land degradation has reduced productivity in 23 per cent of the global terrestrial area, and between $235 billion and $577 billion in annual global crop output is at risk as a result of pollinator loss.

        Desertification

        • Arable land loss is estimated at 30 to 35 times the historical rate
        • Due to drought and desertification, 12 million hectares are lost each year (23 hectares per minute). Within one year, 20 million tons of grain could have been grown.
        • 74 per cent of the poor are directly affected by land degradation globally.
        • Habitat loss and deterioration, largely caused by human actions, have reduced global terrestrial habitat integrity by 30 per cent relative to an unimpacted baseline.

        Biodiversity

        • Illicit poaching and trafficking of wildlife continues to thwart conservation efforts, with nearly 7,000 species of animals and plants reported in illegal trade involving 120 countries.
        • Of the 8,300 animal breeds known, 8 per cent are extinct and 22 per cent are at risk of extinction.
        • Of the over 80,000 tree species, less than 1 per cent have been studied for potential use.
        • Fish provide 20 per cent of animal protein to about 3 billion people. Only ten species provide about 30 per cent of marine capture fisheries and ten species provide about 50 per cent of aquaculture production.
        • Over 80 per cent of the human diet is provided by plants. Only three cereal crops – rice, maize and wheat – provide 60 per cent of energy intake.
        • As many as 80 per cent of people living in rural areas in developing countries rely on traditional plant-­‐based medicines for basic healthcare.
        • Micro-organisms and invertebrates are key to ecosystem services, but their contributions are still poorly known and rarely acknowledged.
        • While protected areas now cover 15 per cent of terrestrial and freshwater environments and 7 per cent of the marine realm, they only partly cover important sites for biodiversity and are not yet fully ecologically representative and effectively or equitably managed.

        Goal 16: Promote just, peaceful and inclusive societies


        Conflict, insecurity, weak institutions and limited access to justice remain a great threat to sustainable development.

        The number of people fleeing war, persecution and conflict exceeded 70 million in 2018, the highest level recorded by the UN refugee agency (UNHCR) in almost 70 years.

        In 2019, the United Nations tracked 357 killings and 30 enforced disappearances of human rights defenders, journalists and trade unionists in 47 countries.

        And the births of around one in four children under age 5 worldwide are never officially recorded, depriving them of a proof of legal identity crucial for the protection of their rights and for access to justice and social services.

        • Among the institutions most affected by corruption are the judiciary and police.
        • Corruption, bribery, theft and tax evasion cost some US $1.26 trillion for developing countries per year; this amount of money could be used to lift those who are living on less than $1.25 a day above $1.25 for at least six years
        • Birth registration has occurred for 73 per cent of children under 5, but only 46per cent of Sub-Saharan Africa have had their births registered.
        • Approximately 28.5 million primary school age who are out of school live in conflict-affected areas.
        • The rule of law and development have a significant interrelation and are mutually reinforcing, making it essential for sustainable development at the national and international level.
        • The proportion of prisoners held in detention without sentencing has remained almost constant in the last decade, at 31per cent of all prisoners.

        Violence against children

        • The number of people fleeing war, persecution and conflict exceeded 70 million in 2018, the highest level recorded by the UN refugee agency (UNHCR) in almost 70 years.
        • In 2019, the United Nations tracked 357 killings and 30 enforced disappearances of human rights defenders, journalists and trade unionists in 47 countries.
        • Violence against children affects more than 1 billion children around the world and costs societies up to US$ 7 trillion a year.
        • 50 per cent of the world’s children experience violence every year.
        • Every 7 minutes, somewhere in the world, a child is killed by violence
        • 1 in 10 children is sexually abused before the age of 18.
        • 9 in 10 children live in countries where corporal punishment is not fully prohibited, leaving 732 million children without legal protection.
        • 1 in 3 internet users worldwide is a child and 800 million of them use social media. Any child can become a victim of online violence.
        • Child online sexual abuse reports to NCMEC has grown from 1 million in 2014 to 45 million in 2018.
        • 246 million children worldwide affected by school-related violence each year.
        • 1 in 3 students has been bullied by their peers at school in the last month, and at least 1 in 10 children have experienced cyberbullying.

        Goal 17: Revitalize the global partnership for sustainable development


        The SDGs can only be realized with strong global partnerships and cooperation.

        A successful development agenda requires inclusive partnerships — at the global, regional, national and local levels — built upon principles and values, and upon a shared vision and shared goals placing people and the planet at the centre.

        Many countries require Official Development Assistance to encourage growth and trade. Yet, aid levels are falling and donor countries have not lived up to their pledge to ramp up development finance.

        Due to the COVID-19 pandemic, the global economy is projected to contract sharply, by 3 per cent, in 2020, experiencing its worst recession since the Great Depression.

        Strong international cooperation is needed now more than ever to ensure that countries have the means to recover from the pandemic, build back better and achieve the Sustainable Development Goals.

        • 79 per cent of imports from developing countries enter developed countries duty-free
        • The debt burden on developing countries remains stable at about 3 per cent of export revenue
        • Trade, foreign direct investment and remittances all projected to decline by up to 40  per cent in 2020.
        • Almost half of the world’s population is not connected to the internet, particularly in poor countries.

        What Is ISO 14001:2015 – Environmental Management Systems?

        Part of the ISO 14000 family of standards on environmental management, ISO 14001 is a voluntary standard that organizations can certify to. Integrating it with other management systems standards, most commonly ISO 9001, can further assist in accomplishing organizational goals.

        The International Organization for Standardization (ISO) defines an environmental management system as “part of the management system used to manage environmental aspects, fulfill compliance obligations, and address risks and opportunities.” The framework in the ISO 14001 standard can be used within a plan-do-check-act (PDCA) approach to continuous improvement.

        WHO SHOULD USE The ISO 14001:2015 revision?

        ISO 14001:2015 should be used by any organization that wishes to set up, improve, or maintain an environmental management system to conform with its established environmental policy and requirements. The requirements of the standard can be incorporated into any environmental management system, the extent to which is determined by several factors including the organization’s industry, environmental policy, products and service offerings, and location.

        ISO 14001:2015 is relevant to all organizations, regardless of size, location, sector, or industry.

        What topics does ISO 14001:2015 cover?

        At the highest level, ISO 14001:2015 covers the following topics with regard to environmental management systems:

        • Context of the organization
        • Leadership
        • Planning
        • Support
        • Operation
        • Performance evaluation
        • Improvement

        ISO 14001 Environmental Management Systems (EMS) Framework
        ISO 14001 Environmental Management Systems (EMS) Framework

        14001:2004 vs. 14001:2015

        The 2015 revision of ISO 14001 introduces a number of changes from previous versions. A review of 20 years of research on this standard is available for ASQ member.

        As part of the effort to structure all ISO standards in the same way, the ISO 14001:2015 revisions include incorporating a required high-level structure, using mandatory definitions, and incorporating common standards requirements and clauses.

        10 major areas of impact of the 2015 revision:

        1. Expansion in EMS coverage and scope
        2. Required interactions with external parties
        3. New requirements for leadership engagement
        4. Expanded legal compliance requirements
        5. Need for risk-based planning and controls
        6. New documentation requirements
        7. Expanded operational control requirements
        8. Changes in competence and awareness requirements
        9. Impacts on the internal audit program
        10. Increased certification costs

        Integrating ISO 9001 and ISO 14001

        Integrating management systems standards can increase focus while reducing the potential for confusion. Elements of ISO 9001 can be enhanced with corresponding components of ISO 14001.

        Responsibilities for the combined standards might include:

        • Drafting a policy statement and quantifiable objectives
        • Setting up organizational charts and job descriptions
        • Providing adequate resources
        • Managing documentation for both standards in a single document control system
        • Appointing a management representative as well as coordinators for the quality and environmental managements systems

        When adding ISO 14001 components to those of ISO 9001, planning must be expanded to deal with environmental impacts, and the inspection and test systems modified to cover environmental conformance. The organization must meet the environmental expectations of customers and the government, and it must incorporate environmental management elements into internal audit programs and training sessions.

        ISO 14001 can be integrated with standards besides ISO 9001 in order to provide synergy with other systems, such as OHSAS 18001 and ISO 13485.

        What are the Benefits of ISO 14001:2015?

        Using ISO 14001:2015 has many benefits for organizations with environmental management systems. Organizations and companies find that using the standard helps them:

        • Improve resource efficiency
        • Reduce waste
        • Drive down costs
        • Provide assurance that environmental impact is being measured
        • Gain competitive advantage in supply chain design
        • Increase new business opportunities
        • Meet legal obligations
        • Increase stakeholder and customer trust
        • Improve overall environmental impact
        • Manage environmental obligations with consistency [4]

        Smart Growth and Logic Models, and Health Impact Assessments

        What is a logic model?

        A logic model presents a picture of how your effort or initiative is supposed to work. It explains why your strategy is a good solution to the problem at hand. Effective logic models make an explicit, often visual, statement of the activities that will bring about change and the results you expect to see for the community and its people. A logic model keeps participants in the effort moving in the same direction by providing a common language and point of reference.

        More than an observer’s tool, logic models become part of the work itself. They energize and rally support for an initiative by declaring precisely what you’re trying to accomplish and how.

        In this section, the term logic model is used as a generic label for the many ways of displaying how change unfolds.

        Some other names include:

        • road map, conceptual map, or pathways map
        • mental model
        • blueprint for change
        • framework for action or program framework
        • program theory or program hypothesis
        • theoretical underpinning or rationale
        • causal chain or chain of causation
        • theory of change or model of change

        Each mapping or modeling technique uses a slightly different approach, but they all rest on a foundation of logic – specifically, the logic of how change happens. By whatever name you call it, a logic model supports the work of health promotion and community development by charting the course of community transformation as it evolves.

        A word about logic

        The word “logic” has many definitions. As a branch of philosophy, scholars devote entire careers to its practice. As a structured method of reasoning, mathematicians depend on it for proofs. In the world of machines, the only language a computer understands is the logic of its programmer.

        There is, however, another meaning that lies closer to heart of community change: the logic of how things work. Consider, for example, the logic to the motion of rush-hour traffic. No one plans it. No one controls it. Yet, through experience and awareness of recurrent patterns, we comprehend it, and, in many cases, can successfully avoid its problems (by carpooling, taking alternative routes, etc.).

        Logic in this sense refers to “the relationship between elements and between an element and the whole.” All of us have a great capacity to see patterns in complex phenomena. We see systems at work and find within them an inner logic, a set of rules or relationships that govern behavior. Working alone, we can usually discern the logic of a simple system. And by working in teams, persistently over time if necessary, there is hardly any system past or present whose logic we can’t decipher.

        On the flip side, we can also project logic into the future. With an understanding of context and knowledge about cause and effect, we can construct logical theories of change, hypotheses about how things will unfold either on their own or under the influence of planned interventions. Like all predictions, these hypotheses are only as good as their underlying logic. Magical assumptions, poor reasoning, and fuzzy thinking increase the chances that despite our efforts, the future will turn out differently than we expect or hope. On the other hand, some events that seem unexpected to the uninitiated will not be a surprise to long-time residents and careful observers.

        The challenge for a logic modeler is to find and accurately represent the wisdom of those who know best how community change happens.

        The logic in logic modeling

        Like a road map, a logic model shows the route traveled (or steps taken) to reach a certain destination. A detailed model indicates precisely how each activity will lead to desired changes. Alternatively, a broader plan sketches out the chosen routes and how far you will go. This road map aspect of a logic model reveals what causes what, and in what order. At various points on the map, you may need to stop and review your progress and make any necessary adjustments.

        A logic model also expresses the thinking behind an initiative’s plan. It explains why the program ought to work, why it can succeed where other attempts have failed. This is the “program theory” or “rationale” aspect of a logic model. By defining the problem or opportunity and showing how intervention activities will respond to it, a logic model makes the program planners’ assumptions explicit.

        The form that a logic model takes is flexible and does not have to be linear (unless your program’s logic is itself linear). Flow charts, maps, or tables are the most common formats. It is also possible to use a network, concept map, or web to describe the relationships among more complex program components. Models can even be built around cultural symbols that describe transformation, such as the Native American medicine wheel, if the stakeholders feel it is appropriate.

        See the “Generic Model for Disease/Injury Control and Prevention” in the Examples section for an illustration of how the same information can be presented in a linear or nonlinear format.

        Whatever form you choose, a logic model ought to provide direction and clarity by presenting the big picture of change along with certain important details. Let’s illustrate the typical components of a logic model, using as an example a mentoring program in a community where the high-school dropout rate is very high. We’ll call this program “On Track.”

        • Purpose, or mission. What motivates the need for change? This can also be expressed as the problems or opportunities that the program is addressing. (For On Track, the community focused advocates on the mission of enhancing healthy youth development to improve the high-school dropout rate.)
        • Context, or conditions. What is the climate in which change will take place? (How will new policies and programs for On Track be aligned with existing ones? What trends compete with the effort to engage youth in positive activities? What is the political and economic climate for investing in youth development?)
        • Inputs, or resources or infrastructure. What raw materials will be used to conduct the effort or initiative? (In On Track, these materials are coordinator and volunteers in the mentoring program, agreements with participating school districts, and the endorsement of parent groups and community agencies.) Inputs can also include constraints on the program, such as regulations or funding gaps, which are barriers to your objectives.
        • Activities, or interventions. What will the initiative do with its resources to direct the course of change? (In our example, the program will train volunteer mentors and refer young people who might benefit from a mentor.) Your intervention, and thus your logic model, should be guided by a clear analysis of risk and protective factors.
        • Outputs. What evidence is there that the activities were performed as planned? (Indicators might include the number of mentors trained and youth referred, and the frequency, type, duration, and intensity of mentoring contacts.)
        • Effects, or results, consequences, outcomes, or impacts. What kinds of changes came about as a direct or indirect effect of the activities? (Two examples are bonding between adult mentors and youth and increased self-esteem among youth.)

        Putting these elements together graphically gives the following basic structure for a logic model. The arrows between the boxes indicate that review and adjustment are an ongoing process – both in enacting the initiative and developing the model.

        Image depicting the basic structure for a logic model. This image includes text boxes and relational arrows with the following phrases: “PURPOSE or MISSION of your program, effort, or initiative; INPUTS or RESOURCES: raw materials used the program; CONSTRAINTS or BARRIERS to program objectives; ACTIVITIES: what the program does with the resources to direct the course of change; OUTPUTS: direct evidence of having performed the activities; EFFECTS or results, consequences outcomes, impacts of having taken action (intended and unintended): short-term, mid-term, longer-term; CONTEXT or CONDITIONS of your work.”

        Using this generic model as a template, let’s fill in the details with another example of a logic model, one that describes a community health effort to prevent tuberculosis.

        Image depicting the basic structure for a logic model. This image includes text boxes and relational arrows with the following phrases: “PURPOSE or MISSION of your program, effort, or initiative; INPUTS or RESOURCES: raw materials used the program; CONSTRAINTS or BARRIERS to program objectives; ACTIVITIES: what the program does with the resources to direct the course of change; OUTPUTS: direct evidence of having performed the activities; EFFECTS or results, consequences outcomes, impacts of having taken action (intended and unintended): short-term, mid-term, longer-term; CONTEXT or CONDITIONS of your work.”

        Remember, although this example uses boxes and arrows, you and your partners in change can use any format or imagery that communicates more effectively with your stakeholders.

        As mentioned earlier, the generic model for Disease/Injury Control and Prevention in Examples depicts the same relationship of activities and effects in a linear and a nonlinear format. The two formats helped communicate with different groups of stakeholders and made different points.

        The linear model better guided discussions of cause and effect and how far down the chain of effects a particular program was successful. The circular model more effectively depicted the interdependence of the components to produce the intended effects.

        When exploring the results of an intervention, remember that there can be long delays between actions and their effects. Also, certain system changes can trigger feedback loops, which further complicate and delay our ability to see all the effects. (A definition from the System Dynamics Society, might help here: “Feedback refers to the situation of X affecting Y and Y in turn affecting X perhaps through a chain of causes and effects. One cannot study the link between X and Y and, independently, the link between Y and X and predict how the system will behave. Only the study of the whole system as a feedback system will lead to correct results.”)

        For these reasons, logic models indicate when to expect certain changes. Many planners like to use the following three categories of effects (illustrated in the models above), although you may choose to have more or fewer depending on your situation.

        • Short-term or immediate effects. (In the On Track example, this would be that young people who participate in mentoring improve their self-confidence and understand the importance of staying in school.)
        • Mid-term or intermediate effects. (Mentored students improve their grades and remain in school.)
        • Longer-term or ultimate effects. (High school graduation rates rise, thus giving graduates more employment opportunities, greater financial stability, and improved health status.)

        Here are two important notes about constructing and refining logic models.

        Outcome or Impact?

        Clarify your language. In a collaborative project, it is wise to anticipate confusion over language. If you understand the basic elements of a logic model, any labels can be meaningful provided stakeholders agree to them. In the generic and TB models above, we called the effects short-, mid-, and long-term. It is also common to hear people talk about effects that are “upstream” or “proximal” (near to the activities) versus “downstream” or “distal” (distant from the activities). Because disciplines have their own jargon, stakeholders from two different fields might define the same word in different ways.

        Some people are trained to call the earliest effects “outcomes” and the later ones “impacts.” Other people are taught the reverse: “impacts” come first, followed by “outcomes.” The idea of sequence is the same regardless of which terms you and your partners use. The main point is to clearly show connections between activities and effects over time, thus making explicit your initiative’s assumptions about what kinds of change to expect and when. Try to define essential concepts at the design stage and then be consistent in your use of terms. The process of developing a logic model supports this important dialogue and will bring potential misunderstandings into the open.

        For good or for ill?

        Understand effects. While the starting point for logic modeling is to identify the effects that correspond to stated goals, your intended effect are not the only effects to watch for. Any intervention capable of changing problem behaviors or altering conditions in communities can also generate unintended effects. These are changes that no one plans and that might somehow make the problem worse.

        Many times our efforts to solve a problem lead to surprising, counterintuitive results. There is always a risk that our “cure” could be worse than the “disease” if we’re not careful. Part of the added value of logic modeling is that the process creates a forum for scrutinizing big leaps of faith, a way to searching for unintended effects. (See the discussion of simulation in “What makes a logic model effective” for some thoughts on how to do this in a disciplined manner.)

        One of the greatest rewards for the extra effort is the ability to spot potential problems and redesign an initiative (and its logic model) before the unintended effects get out of hand, so that the model truly depicts activities that will plausibly produce the intended effects.[5]

        Health Impact Assessment

        This website is archived for historical purposes and is no longer being maintained or updated.

        people walking and biking

        Health impact assessment (HIA) is a tool that can help communities, decision makers, and practitioners make choices that improve public health through community design.

        CDC’s Healthy Community Design Initiative is the only source of federal expertise to help states and communities integrate health considerations into transportation and community planning decisions. Learn more about the Healthy Community Design Initiative’s funded HIA programs and HIA accomplishments.

        In the United States, HIA is a rapidly emerging practice among local, state, and federal jurisdictions.

        What Is HIA?

        HIA is a process that helps evaluate the potential health effects of a plan, project, or policy before it is built or implemented. HIA brings potential positive and negative public health impacts and considerations to the decision-making process for plans, projects, and policies that fall outside traditional public health arenas, such as transportation and land use. An HIA provides practical recommendations to increase positive health effects and minimize negative health effects.

        The major steps in conducting an HIA include

        • Screening (identifying plan, project, or policy decisions for which an HIA would be useful).
        • Scoping (planning the HIA and identifying what health risks and benefits to consider).
        • Assessment (identifying affected populations and quantifying health impacts of the decision).
        • Recommendations (suggesting practical actions to promote positive health effects and minimize negative health effects).
        • Reporting (presenting results to decision makers, affected communities, and other stakeholders).
        • Monitoring and evaluation (determining the HIA’s impact on the decision and health status).

        HIA is usually voluntary, though several local and state laws support the examination of health impacts in decision making and a few explicitly require the use of HIA. HIA is different from a public health assessment, a health risk assessment, and an environmental impact assessment. Learn more about the different types of health assessments listed below. [6]

        Health Impact Assessment

        Health impact assessment (HIA) is used to evaluate the public health consequences of proposed decisions in non-health sectors. HIA is a systematic process that uses an array of data sources and analytic methods and considers input from stakeholders to determine the potential effects of a proposed policy, plan, program, or project on the health of a population and whether the health effects are distributed evenly within the population. HIAs provide practical recommendations for how to minimize negative health effects and maximize beneficial health effects. [Source: National Academies Press]
        HIA should be distinguished from other health assessment methodologies, described below, that can be used during or after an HIA.

        Community Health Assessment

        A community health assessment, or community health needs assessment, is a systematic examination of the health status indicators for a given population that is used to identify key problems and assets in a community. The ultimate goal of a community health assessment is to develop strategies to address the community’s health needs and identified issues. Community health assessment is a prerequisite for tribal, state, local, or territorial public health departments seeking voluntary accreditation. A variety of tools and processes may be used to conduct a community health assessment; the essential ingredients are community engagement and collaborative participation. [Source: Public Health Accreditation Board]

        Data obtained on health status and community health needs and assets during a community health assessment can be used in an HIA to describe the existing health status of the affected population.

        Cost-Benefit Analysis

        Cost-benefit analysis is a type of economic evaluation that measures both costs and benefits (i.e., negative and positive consequences) associated with an intervention in dollar terms.
        Because HIA typically does not examine the costs associated with its recommended strategies to promote health and mitigate adverse health impacts, a cost-benefit analysis could be conducted to help decide which HIA recommendations are the most feasible. For more information, see CDC’s Introduction to Prevention Effectiveness.

        Environmental Impact Assessment

        Environmental impact assessment (EIA) is the process of identifying, predicting, evaluating and mitigating the biophysical, social, and other relevant effects of proposed developments prior to major decisions being made. EIAs are currently a requirement in most countries. [Source: International Association of Impact Assessment]

        In the United States, the National Environmental Policy Act (NEPA) requires federal agencies to integrate environmental values into their decision-making processes by considering the environmental impacts of their proposed actions and reasonable alternatives to those actions. To meet NEPA requirements, federal agencies first prepare an environmental assessment (EA) to determine whether a more thorough environmental impact statement (EIS) is needed. For more information on NEPA, visit the U.S. Environmental Protection Agency website.

        NEPA requires consideration and analysis of health effects of specified federal agency actions within the EIA process. Although NEPA does not refer to HIA as a separate requirement, HIA can be an appropriate way to meet statutory requirements for health effects analysis when conducted within the context of an interdisciplinary EIA.

        Bhatia and Wernham (2008) reviewed the purpose and procedures of EIA, existing regulatory requirements for health effects analysis, and potential barriers to and opportunities for improving integration of human health concerns within the EIA process. The authors suggested that EIA might be an unrealized opportunity for improving environmental health and justice.

        Human Health Risk Assessment

        A human health risk assessment is a quantitative, analytic process to estimate the nature and risk of adverse human health effects associated with exposure to specific chemical contaminants or other hazards in the environment, now or in the future. For more information, see the U.S. Environmental Protection Agency website.

        Human health risk assessments are not comprehensive and tend to focus on biophysical risks from exposure to hazardous substances. Results from a human health risk assessment can be used within an HIA to predict human health effects of specific exposures.

        Public Health Assessment

        The Agency for Toxic Substances and Disease Registry (ATSDR) developed the public health assessment process for evaluating the public health implications of exposures to environmental contamination. A public health assessment is formally defined as “The evaluation of data and information on the release of hazardous substances into the environment in order to assess any past, current, or future impact on public health, develop health advisories or other recommendations, and identify studies or actions needed to evaluate and mitigate or prevent human health effects” [Source: 42 Code of Federal Regulations, Part 90]. See the ATSDR Public Health Assessment Guidance Manual for more information.[7]

         An Important Assessment Tool

        HIA is a useful tool to assess how a proposed decision will affect the health of a population and whether vulnerable populations are more likely to be impacted [or whether the health impacts are distributed evenly within the population]. The goal of HIA is to provide recommendations during the decision-making process that will protect health and reduce health inequities. Below are examples of how HIA has been recommended as an important assessment tool.

        CDC cosponsored the 2011 National Research Council report Improving Health in the United States: The Role of Health Impact Assessment, which found that the HIA holds promise for incorporating aspects of health into decision making because of its

        • Applicability to a broad array of policies, programs, plans, and projects.
        • Consideration of adverse and beneficial health effects.
        • Ability to consider and incorporate various types of evidence.
        • Engagement of communities and stakeholders in a deliberative process.[8]

        Elements of a Health Impact Assessment3 Elements of a Health Impact Assessment.” National Research Council. 2011. Improving Health in the United States: The Role of Health Impact Assessment. Washington, DC: The National Academies Press. doi: 10.17226/13229

        Chapter 2 established the rationale for examining the potential effects of decisions on health and health disparities and highlighted health impact assessment (HIA) as a potential tool for assessing the health implications of various decisions. This chapter describes the types, structure, and content of HIAs and summarizes the HIA process, methodologic approaches, and variations in practice. It is informed by a review of U.S. and international HIA literature and guidelines (see Appendixes A and E) and by the experience of committee members and others who provided input during the committee process. On the basis of its review, the committee synthesized the information from guidance, practice, and literature to propose criteria that define an HIA and draw several conclusions regarding HIA practice. As discussed in this chapter, HIAs have been used for a wide variety of applications and at all levels of government (local, state, tribal, and federal) and have been conducted with varied resources over different schedules. The committee does not intend that the definition and criteria proposed in this chapter be considered rigid requirements but rather that they reflect an ideal of practice, deviation from which may occur but should be based on clear and well-articulated needs and rationale.

        Before discussing the various elements of HIA, it is important to understand the context in which HIA is undertaken in the United States. As described in Appendix A, there are few laws in the United States that specifically require HIA, although many—such as the National Environmental Policy Act (NEPA)—require a consideration of health that can be accomplished through HIA. Most HIAs in the United States are therefore undertaken outside the formal decision-making process by organizations (such as nonprofit community-based groups), universities, or health departments that do not have decision-making authority over the proposals being addressed. Although less common to date, HIAs are also sometimes conducted by a decision-making agency, such as a metropolitan planning organization or a federal agency complying with NEPA. The decision to initiate an HIA is often made ad hoc when public-health advocates recognize that the proposal may have important health implications that would not otherwise be recognized or addressed. There are often not clear lines of authority between the team conducting the HIA and the decision-maker. The health effects that are included, the data sources and methods that are used, and the recommendations that are made are therefore determined by the HIA practitioners rather than according to a legal or regulatory standard (Wernham 2011). Thus, the assessment phase is separated from the management phase, as recommended elsewhere (NRC 1983). The fact, however, that the team conducting the HIA is aware of the decision context allows the assessment to be decision-relevant.

        CATEGORIES OF HEALTH IMPACT ASSESSMENT

        Scholars point to a remarkable consistency in the basic elements that are generally included in descriptions of HIA (Mindell et al. 2008). In practice, however, there is some inconsistency in how HIAs are conducted—for example, how stakeholders are engaged and how data are collected and analyzed—and in the structure and content of the final work products of an HIA. The diversity of practice owes partly to the fact that HIAs are undertaken for a wide array of policy-making that spans many sectors, levels of government, types of proposal (policies, plans, programs, and projects), and degrees of complexity. The variability in the practice has evolved in the absence of widely accepted practice standards or formal regulatory or procedural requirements for HIA outside NEPA and related state laws (see Appendix A). However, it appears to be increasingly accepted that HIA is carried out to inform the decision rather than to evaluate the impacts after the decision is made, and there is general agreement on the procedural steps of HIA (Harris-Roxas and Harris 2011).

        HIA practice is often defined in terms of several categories. According to effort, complexity, and duration, HIAs are often described as rapid, intermediate, or comprehensive. Rapid HIAs may be completed in a short time (weeks to months), are often focused on smaller and less complex proposals, and generally involve primarily literature review and descriptive or qualitative analysis. The phrase desktop HIA has also been used to refer to a rapid HIA that entails little or no public engagement. Another variation, rapid-appraisal HIA, has been described and in some texts includes explicit public engagement through an initial half-day workshop for stakeholders (Parry and Stevens 2001; Mindell et al. 2003; ICMM 2010). Intermediate HIAs require more time and resources and involve more complex pathways, more stakeholder engagement, and a more detailed analysis but include little collection of new data. Comprehensive HIAs are most commonly differentiated from rapid and intermediate HIAs by the scope of potential impacts and the need for collection of new primary data. They can take longer than a year to complete.

        HIAs are also differentiated according to whether they are integrated into an environmental impact assessment or done independently. Another categorization is based on the breadth of the HIA and distinguishes HIAs that have a tight focus—such as ones that use a narrow definition of health and emphasize quantification—from HIAs that have a broader, holistic focus shaped by the social determinants of health (Kemm 2001). Others have proposed categorizing HIAs as participatory (emphasizing shared governance, public participation, and a focus on socioeconomic and environmental determinants), quantitative or analytic (concentrating on the methods and rigor of the analysis), or procedural (drawing on elements of the other two approaches but emphasizing the procedural steps required and often undertaken within a specified administrative or regulatory context) (Cole and Fielding 2007).

        In practice, the categories are rarely used consistently, and a single HIA often encompasses a blend of various approaches to stakeholder engagement and participation, analytic methods, and interactions with the formal decision-making process. For example, desktop HIAs may consider indirect stakeholder input through review of public comments submitted outside the HIA process, comprehensive HIAs may have relatively little stakeholder engagement, and rapid-appraisal HIAs of smaller-scale proposals may involve collection of some new data to inform the analysis. The various categories of HIAs, although useful for describing distinct themes in the field, do not necessarily represent consistently distinct strains of practice. Instead, it appears that the specific methods and approaches used in a single HIA often evolve within the basic framework described above and develop as a pragmatic response to context. Influences on practice include the timeline, resources and skills available to the HIA team, the factors being considered and the data available for analysis, and the legal and regulatory context of the decision-making process. That description is consistent with the earlier characterizations of HIA as a combination of procedures, methods, and tools (WHO 1999; Quigley et al. 2006).

        The committee notes that the diversity of approaches and decision contexts imposes challenges for determining the resources required for conducting an HIA. For example, although rapid HIAs are small-scale, low-cost investigations, comprehensive HIAs that require new primary data collection can take longer than a year to complete and require substantially more resources. Information on costs of HIAs would be valuable in determining whether an HIA can be undertaken with the resources available and could inform the screening process as described below. However, the committee notes that no published studies in the United States have attempted to quantify the costs of undertaking an HIA across a variety of settings. Such information would be useful for informing future implementation.

        DEFINITION OF HEALTH IMPACT ASSESSMENT

        The committee proposes on the basis of its review the following adaptation of the current working definition of the International Association of Impact Assessment (Quigley et al. 2006) as a technical definition of HIA:
        HIA is a systematic process that uses an array of data sources and analytic methods and considers input from stakeholders to determine the potential effects of a proposed policy, plan, program, or project on the health of a population and the distribution of the effects within the population. HIA provides recommendations on monitoring and managing those effects.

        That definition reflects the committee’s finding that the involvement of stakeholders—although the approaches used vary from little or no involvement to robust engagement and participation at every step—has consistently been described as a core element of HIA practice and should be considered essential to it. Although rapid or desktop HIAs may not involve stakeholders or consider their input, this often (although not uniformly) reflects a pragmatic response to limitations, such as the timeframe for the decision or resources available to the HIA team, rather than an optimal practice. The definition also notes that recommendations should incorporate monitoring, which is essential for effective continuing management as a decision is implemented.

        WHO CONDUCTS HEALTH IMPACT ASSESSMENTS?

        HIAs can be conducted by a variety of agencies, organizations, or individuals. A decision-making body—such as a department of planning or transportation—can conduct an HIA to inform its own decision. It is also common for local, state, or tribal health departments to undertake an HIA to inform another agency’s decision-making. University researchers have conducted HIAs, and community-based organizations have conducted HIAs with technical assistance from public-health experts to inform officials who are deliberating on a legislative or administrative proposal. HIAs are also done by private consultants who are hired by a project proponent or decision-maker or by private-industry stakeholders.

        Because the assessment of health effects depends on an in-depth understanding of changes that may affect health—such as changes in traffic flow, roadway design, air quality, or community revenue sources—HIAs are inherently multidisciplinary; public-health experts may lead the effort but must draw on resources and expertise from other disciplines. Thus, HIA teams may include not only health experts but professionals in other related disciplines, such as air or water quality or traffic modeling. As discussed in greater depth in the section on scoping, it is common to convene advisory or steering committees, which can include both technical and policy experts and representatives from stakeholder groups that have an interest in the decision outcome.

        The training and credentials of HIA practitioners are variable, and there is no universally accepted standard for a level of training necessary to lead an HIA. In the United States, HIAs have commonly been undertaken by people who have an MPH or equivalent degree and have attended a brief (2- to 5-day) training
        session. In this report, HIA practitioner refers to the person (or people) involved in conducting an HIA.

        PROCESS FOR HEALTH IMPACT ASSESSMENT

        The tasks or elements that are described as part of an HIA are fairly consistent in the peer-reviewed literature and guides reviewed by the committee. The grouping of the elements in discrete stages or steps of an HIA is less consistent; some guides list as few as five steps, and others describe as many as nine (Quigley et al. 2006; Bhatia 2010; ICMM 2010). The committee selected a six-step framework as a clear way to organize and describe the critical elements of an HIA. The steps can be described as follows:

        (1) Screening determines whether a proposal is likely to have health effects and whether the HIA will provide information useful to the stakeholders and decision-makers.

        (2) Scoping establishes the scope of health effects that will be included in the HIA, the populations affected, the HIA team, sources of data, methods to be used, and alternatives to be considered.

        (3) Assessment involves a two-step process that first describes the baseline health status of the affected population and then assesses potential impacts.

        (4) Recommendations suggest design alternatives that could be implemented to improve health or actions that could be taken to manage the health effects, if any, that are identified.

        (5) Reporting documents and presents the findings and recommendations to stakeholders and decision-makers.

        (6) Monitoring and evaluation are variably grouped and described. Monitoring can include monitoring of the adoption and implementation of HIA recommendations or monitoring of changes in health or health determinants. Evaluation can address the process, impact, or outcomes of an HIA.

        The following sections provide an overview of the process of conducting an HIA. For each step, the committee describes the basic purpose, objectives, and practice elements; summarizes the main outputs; and presents conclusions regarding pertinent issues raised. Major issues and challenges for HIA development and practice are considered in Chapter 4. The reader will notice that some of the committee’s descriptions and characterizations overlap with those of other guides; the similarities highlight the consistencies in the field.

        Screening

        Screening establishes the need for and value of conducting an HIA. Because HIAs can address decisions that range from small, localized programs or projects to national policies, screening ensures that HIA is used judiciously and when it is most likely to be valuable. Given the volume and breadth of decisions at the local, state, tribal, and federal levels that can potentially affect health in some way, one of the challenges for HIA practice is to determine which proposals to screen. In the absence of mandates or formal procedures, topics for screening are often chosen on the basis of the interests of a group wishing to use HIA as opposed to a structured, strategic selection process.1

        More structured approaches have also been used. In some cases, collaboration between a health department and other agencies has resulted in the identification of appropriate proposals for screening. In other cases, all proposals in selected agencies or sectors have been screened by local governments (SFCC 1998; Lester et al. 1999; Roscam Abbing 2004). For example, the San Francisco Department of Public Health routinely screens major projects and plans to ensure adequate analysis and mitigation of environmental health impacts. In Alaska, all large natural-resources development proposals are now screened for the need for HIA in a new program begun by the state health department.

        Screening involves making an initial rapid judgment of whether an HIA is likely to be feasible and valuable. The central considerations include whether the proposal in question might cause important changes in health, whether health is already a major focus of the decision-making process, whether the legal framework provides an opportunity for health to be factored into the decision, and whether data, staff, resources, and time are adequate to complete a successful HIA in time to provide useful input into the decision-making process (that is, can information be provided within the timeline for the decision). Another consideration is whether the proposal is likely to place a disproportionate burden of risk on vulnerable populations in the affected community; screening proposals on this basis helps to ensure that the HIA addresses the risk factors that underlie observed disparities in the rates of illness among various populations.

        A variety of screening tools and algorithms are commonly used (Cole et al. 2005; PHAC 2005; Harris et al. 2007; Bhatia 2010). Some use pertinent screening questions, such as the ones noted, and apply a sequential yes-no query to each (Cole et al. 2005). Some provide a checklist of factors to consider and often focus on health determinants that might be affected by the proposal. Some decisions to conduct HIA may depend on a specific statutory requirement or mandated procedure. For example, in the context of NEPA, the lead federal agency must consider “the degree to which the proposed action affects public health or safety” to determine whether a proposal is likely to have “significant” effects and therefore require an environmental impact statement (40 CFR 1508.27). Ultimately, regardless of the specific tool used, the decision to conduct HIA in most cases relies on the practitioner’s or decision-maker’s judgment regarding the likelihood of impacts, the time and resources available, and the likelihood that the information produced by the HIA will be a valuable aid to decision-making.

        1Under NEPA, a federal agency must determine whether a federal environmental decision is likely to have significant effects, and if so, the level of analysis required (40 C.F.R. Section 1508.27). Because the degree to which the proposed action affects public health or safety is one factor considered, this process could be considered the equivalent of the screening step of an HIA. In practice, however, explicit consideration of health has been rare (Steinemann 2000; Cole et al. 2004; Bhatia and Wernham 2008).

        Because any actions taken on the basis of HIA recommendations need to be implemented within a specific legal and policy context, screening needs to establish a clear description of the decision-making process and context. It should also identify the points at which there is an opportunity for information from the HIA to influence decisions. Mapping out the timeline for the decision-making process can be helpful, and for large and complex programs and projects, identifying the agencies involved and their jurisdictions is important. Such programs and projects involve many agencies and entities that have authority over some aspect of planning and implementation. For example, the planning of the Atlanta Beltline, as described later in this chapter, involved the regional planning commission, local legislative bodies, state and federal environmental regulators, and private developers. It is also useful to assess the political context of the proposal to be assessed and consider, for example, the major political drivers of the proposal, the arguments made by political supporters and those opposed to the proposal, and any economic or technical constraints that limit the alternatives that can be considered.

        Public concerns are a common trigger for a decision to screen, and the degree of concern or controversy about a proposal may be one of the factors weighed in the decision to undertake an HIA. For example, the Massachusetts Department of Public Health responded to citizen concerns regarding a proposed power plant by considering whether HIA would be an appropriate way to address them (McAuliffe 2009). The committee notes that public involvement is important in screening; information provided by stakeholders may provide insight into the potential effects of a proposal under consideration that contribute to the final determination of whether an HIA is warranted and likely to be useful.

        Screening is often not well documented, and it is often not clear from an HIA report what factors were considered in making the decision to do an HIA. Moreover, because there is generally no written record of HIAs that stop at screening, still less is known about the reasons that have led to decisions not to proceed with HIA. Box 3-1 provides an example of how screening on a proposal for a residential housing program was conducted. It includes the information that was taken into account and the final output of the screening process, which was a decision on whether to commission and proceed with an HIA.

        Outputs of Screening

        Screening should result in a simple statement that includes the following:
        •   A description of the proposed policy, program, plan, or project that will be the focus of the HIA, including the timeline for the decision and intervention points at which HIA information will be used.

        •   A statement of why the proposal was selected for screening.

        •   A preliminary opinion regarding the potential importance of the proposal for health.

        •   The expected resource requirements of the HIA and the ability of the HIA team to meet them.

        •   A description of the political and policy context of the decision and an analysis of the opportunities to influence decision-making or otherwise make health-oriented changes.

        BOX 3-1 Screening: HIA of a Residential Housing Program

        The Crossings is a proposed housing development in Los Angeles that will provide 450 units in a newly rezoned residential area that needs affordable housing. A local community-based organization worked with a housing developer on the proposal and site plan. They expressed “interest in developing The Crossings in a way that will address local community needs for affordable housing and for other community assets that are safe, healthy, and supportive” (p. Intro-1).

        In 2009, an HIA was conducted to ensure that health impacts were considered in the design and development of The Crossings and in the broader policies that affected redevelopment in the area. The HIA report describes the screening process but does not provide great detail about it.

        The HIA notes that the area within which The Crossings is proposed to be built has the following characteristics:

        •   A growing population of families that have children.

        •   Dilapidated housing conditions.

        •   Prevalence of overcrowding.

        •   A lack of access to needed goods and services.

        The HIA notes that the residential area is inhabited by a vulnerable population, that the built environment is of low quality, that the development will potentially have important health implications for residents in the local and surrounding communities, and that there is a strong commitment shown by the community and the developer to integrate health considerations into the planning process. It was concluded during the screening phase that an HIA would add value to project outcomes. An HIA would identify health assets, health liabilities, and health-promoting mitigations related to the proposed development project. The facts that resources were available and that timelines were appropriate were also relevant to the decision to conduct an HIA.

        •   A screening recommendation—for example, no further action required; no HIA, but health advice and input to be offered in an alternative way; or proceed with HIA.

        Committee Conclusions Regarding Screening

        Screening is essential for high-quality HIA. Poorly selected proposals may result in HIAs that add little new information and consume considerable time and resources of the HIA team to complete and of recipients to review. HIA should not be assumed to be the best approach to every health-policy question but should instead be seen as part of a spectrum of public-health and policy-oriented approaches, some of which will be more appropriate than others, depending on the specific application. Although the reasons and objectives for HIA are often not articulated at the outset of screening, establishing well-defined objectives will focus the screening process on determining whether HIA is likely to be an effective approach for achieving them.

        Any approach to determining which proposals will be screened should demonstrate a consistent rationale; should document the rationale in the HIA report; and should take account of public input. Screening should also consider whether a proposal conforms with applicable standards, policies, or laws relevant to health inasmuch as there is a wide variety of them that bear directly or indirectly on health. For example, U.S. priorities for improving public health are expressed in the Healthy People 2020 Program of the U.S. Department of Health and Human Services (DHHS 2010). Some laws—such as NEPA, state environmental-policy acts, and various local zoning ordinances—may establish protection of health as a requirement or priority. The programs and policies, however, may not provide any guidance on how health should be considered (see, for example, Pub. L 91-190, 42 U.S.C. 4321-4347 [1970]; EC 2001). Furthermore, some policies may focus on determinants of health—for example, economic development, transportation, or housing—rather than explicitly mentioning health. In each case, it is important to determine how the standards, policies, programs, and laws bear on how health is factored into a proposal.

        The committee concludes that the following are the most important factors to consider in determining whether to do an HIA:

        •   The potential for substantial adverse or beneficial health effects and the potential to make changes in the proposal that could result in an improved health risk-benefit profile.

        •   The potential for HIA-based information to alter a decision or help a decision-maker discriminate among decision options.

        •   The potential for irreversible or catastrophic effects (including effects of low likelihood).

        •   The potential for health effects to place a disproportionate burden on or substantially benefit vulnerable populations.
        •   Public concern or controversy regarding health effects of the proposed decision.

        •   The opportunity to bring health information into a decision-making process that may otherwise not include this information.

        •   The potential for the HIA to be completed in the time allotted and with the resources available.

        Ultimately, the HIA report should provide a rational and consistent explanation of how proposals are selected for screening. That explanation is particularly important when public funds are to be used for an HIA because the public may want to understand the basis for allocating sparse public resources. Given the breadth of decisions that are likely to warrant consideration, the approach taken will vary on the basis of who is initiating the HIA, the capacity and authority of the agency or entity undertaking it, and the objectives for contemplating an HIA.

        Scoping

        Scoping establishes the boundaries of the HIA and identifies the health effects to be evaluated, the populations affected, the HIA team, sources of data, methods to be used, and any alternatives to be assessed. Well-executed scoping saves time, work, and resources in the later stages of the HIA (Harris et al. 2007). The choice of what to evaluate will reflect the specific social, political, and policy context of the decision; the needs, interests, and questions of stakeholders and decision-makers; and the health status of the affected population.

        Potential Health Effects

        Determining the potential health effects to include in the HIA and proposing hypothetical causal pathways are the central tasks of scoping. Scoping considers input from many sources, including preliminary literature searches, public input, and professional or expert opinion in fields relevant to the proposal. Because it will often not be practical or possible to address all direct and indirect health effects that appear theoretically possible, it is important to select issues carefully.2 Setting priorities considers pathways that appear most important from a public-health perspective and considers issues that have been raised prominently by stakeholders. Questions that are important from a public-health perspective might include the severity of the health effect, the size and likelihood of the effect, and the potential of the effect to exacerbate health disparities. In practice, some HIAs have focused on a specific health end point, such as obesity, or health concerns related to a single impact of the proposal, such as the health effects of air pollutants, most likely without using a systematic approach that considered and eliminated other impacts (see, for example, Kuo et al. 2009; Castro et al. 2010).

        Iteration during scoping and between scoping and assessment often results in additional changes in the final list of issues included in the HIA. During scoping, the HIA team may produce an initial list, refine it on the basis of stakeholder input, and then make it final through research and analysis in the assessment phase. In other cases, the initial scope is generated by stakeholders and then refined through research and input from advisory or steering committees.

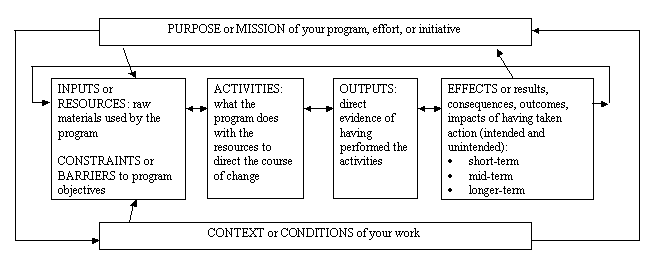
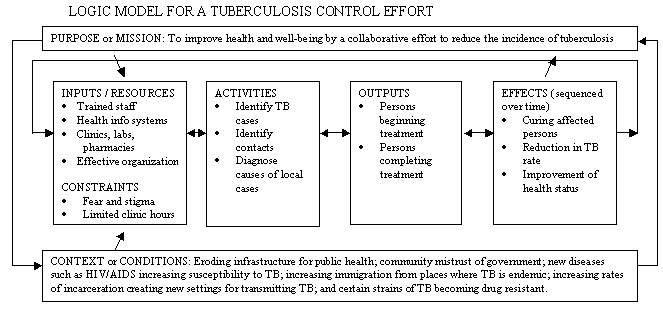
        Several approaches for scoping are available. One approach uses a logic framework that maps out the causal pathways by which health effects might occur (see Figure 3-1). In general, this approach describes effects directly related to the proposal (such as changes in air emissions) and traces them to health determinants (such as air quality) and finally to health outcomes (such as asthma). The first step in the framework is typically a determinant of health, such as air pollution, traffic, employment, or noise. Logic frameworks can be used as part of stakeholder engagement to develop a shared understanding of how a project will develop and the outcomes that can be expected (Cave and Curtis 2001a,b; Cave et al. 2001). Another method of scoping is to develop a table that facilitates a systematic and rapid appraisal of all the potential ways in which a proposal might affect health (see Table 3-1). In this approach, the aspects of a proposal that may affect health are listed and considered in major categories of health and illness.

        Box 3-2 provides an example of scoping for the HIA of a proposed development in Atlanta. The health issues were identified by determining the populations that would be affected and then considering how they would be affected. A variety of information was used to inform the process

        Establishing Who Might Be Affected

        Scoping identifies those likely to be affected by the proposed policy, project, program, or plan. The process may include identifying communities and geographic regions; demographic, economic, racial, and ethnic groups; and vulnerable populations, such as children, elderly people, disabled people, low-income people, racial and ethnic minorities, and people who have pre-existing health conditions. The process of describing pre-existing health issues, health disparities, and influences on health may also begin during scoping, although the full characterization of baseline health status generally takes place during assessment.


        FIGURE 3-1 Example of a logic framework that maps out the possible causal pathways by which health effects might occur. Source: SFDPH 2011.

        TABLE 3-1 Example of a Table Used for Systematic Scoping
        Potentially Affected Areas Health Category
        Chronic Disease Infectious Disease Injury Nutrition Well-being or Psychosocial
        Environment
        • Air quality
        • Water quality
        • Soil
        • Other
        Economy
        • Personal (income, employment; can include occupational risk)
        • Revenue or expense to local, state, or tribal government (support for or drain on services, infrastructure)
        Infrastructure
        • Need for new roads and transit, water, or sanitation systems
        • Demand on existing infrastructure
        Services
        • New services as a direct result of proposal
        • Drain on existing services resulting from proposed action
        Demographics
        • Community composition
        • Traffic volume
        • Residential or commercial use patterns
        Other

        BOX 3-2 Scoping: Atlanta BeltLine HIA

        As described by Ross (2007, p. 9), “the Atlanta BeltLine is a transit, trails, parks, and redevelopment project that uses a 22-mile loop of largely abandoned freight rail line that lies between two and four miles from the city center” and affects about 45 neighborhoods. In 2005, an HIA was conducted by a multidisciplinary team. The goal was to incorporate health considerations into the decision-making process “by predicting health consequences, informing decision makers and the public about health impacts, and providing realistic recommendations to prevent or mitigate negative health outcomes” (p. 9).

        One of the first steps in identifying the parameters of the assessment was to establish an understanding of the BeltLine, a complex project that had been evolving for several years and was expected to be constructed over a 30-year period. The HIA team needed an authoritative description on which to base its assessment. The Atlanta Development Authority’s BeltLine Redevelopment Plan (November 2005) was identified as a coherent and publicly accepted vision that had been approved by local elected officials (ADA 2005). The source of public funding for the project was the Tax Allocation District (TAD), and only within the district’s boundaries could funding be collected and bond money spent. A variety of planning and zoning, funding, and environmental regulatory decisions were required for the BeltLine’s various components to be developed.

        The HIA team was assisted by an advisory committee, but it appears that the committee was not involved in the scoping. The HIA report states that scoping was done by the HIA team and involved desk-based research and a web and postal survey. The scoping phase was used to identify the parameters of the assessment, the affected and most vulnerable populations, and potential key health effects. The final HIA report describes each factor (see below) and presents the results of the scoping. The entire decision-making process is appropriately not described in the final report; however, the reader is not told whether the HIA team prepared a scoping report or whether it presented the findings of the scoping stage.

        Affected populations: As the TAD constituted only a portion of the city that would be directly affected, the HIA team created the HIA study area by placing a 0.5-mile buffer around the BeltLine TAD. The HIA study area was divided into five planning areas, and census (2000) and mortality data were used to analyze the population profiles. Variations were found in race, age, employment status, poverty, car ownership, and mortality. It was not possible to derive mortality rates for demographic subgroups. Behavioral Risk Factor Surveillance System data were used for the county and the state and stratified by race.

        Most vulnerable populations: Less information was provided about this step. The most vulnerable populations were identified as people of low economic status, children, older adults, renters, and the carless. Calculations were conducted to develop a vulnerability score. The top 10% of the census tracts within the study area were then identified as locations of the most vulnerable populations.

        Key health effects: Issues were identified through analysis of newspaper coverage; outreach to such groups as local officials, members of the public, and businesses; development of a logic framework; and a survey of people living, working, or attending school near the BeltLine. The HIA team identified the following critical issues that could affect the health of the study area population: access and social equity, physical activity, safety, social capital, and environment (including air quality, noise, and water management). Source: Adapted from Ross 2007.


        The HIA Team, Advisory Bodies, and Stakeholder Involvement

        Scoping also determines who will be part of the HIA team and establishes a plan for technical oversight and review, stakeholder participation and involvement, and involvement of and interaction with decision-makers. Commonly, a core team is responsible for the bulk of writing and analysis. In some cases, the team may draw on outside consultants who have expertise in a specific health issue or method. Furthermore, HIA teams commonly rely on analyses by such experts as traffic-safety engineers or air-quality analysts who provide information on the links between the proposal and changes in health determinants.

        Advisory, steering, and technical oversight committees are also commonly convened during scoping. Membership is variable but may include representatives of affected communities or community-based organizations, industrial proponents or business groups, public-health experts, officials involved in the decision-making process, and others who have a stake in the outcome. The committees may be convened for several purposes, including providing technical guidance or peer review, ensuring adequate and fair representation of diverse interests and priorities among stakeholders, communicating the results of the HIA to decision-makers, and developing recommendations that address community needs and are compatible with the specific legal requirements of the decision-making process.

        Public and stakeholder participation during scoping can serve several important purposes, such as providing local knowledge regarding existing conditions and potential impacts, introducing alternatives or mitigation measures that stakeholders would endorse as effective ways to address key concerns, and allowing representative participation in shaping the terms of the HIA by groups affected by the proposal. Scoping also establishes a plan for stakeholder participation in later phases of the HIA. The early and central role of stakeholder identification and participation is analogous to the guidance provided in the report published by the Presidential/Congressional Commission on Risk Assessment and Risk Management (1997).

        The approaches taken for stakeholder involvement vary widely. The variation partly reflects the wide array of applications of HIA; for example, it is not necessary or feasible to use the same approaches to involve stakeholders for a local project and for a high-level state or national policy. That issue is discussed at greater length in Chapter 4.

        Data Sources and Methods

        Scoping identifies appropriate data sources for the analysis and should also identify important data gaps. In some cases, the timeline and available resources will prevent collection of new data to address gaps that are identified. In others, scoping may identify studies that can be carried out by the HIA team or studies that can be carried out by experts involved in some other aspect of the planning, permitting, or review process (such as air-quality or traffic-safety analysis). Scoping also establishes a plan for the analytic methods that will be used during the assessment phase. The specific methods used in assessment are discussed in depth in the next section.

        Alternatives

        Another issue that should be addressed in scoping is identifying alternatives to the proposed action. The cornerstone of an assessment that is conducted to comply with NEPA is the presentation of a set of reasonable alternatives to the proposed action; the assessment then considers the impacts of the proposed action and the alternatives. Assessing alternatives in parallel with the proposal can aid decision-making by highlighting tradeoffs and actions that can be taken to achieve the desired outcome while minimizing harms. Because HIA in the United States is often undertaken outside a formal legal mandate, it has not consistently included alternatives assessment. The committee concludes that when alternatives to the proposal being assessed are under consideration, the HIA team should assess the impacts of each alternative. Because developing an alternative (such as suggesting an alternate route for a proposed highway) involves many considerations that may be outside the purview and expertise of an HIA team, the committee recognizes that it may not be practical to expect the HIA team to develop alternatives independently. However, where practical, the HIA team should aim to evaluate a variety of alternatives or, minimally, to identify the characteristics of proposed actions that would be health-protective or detrimental to health. For example, although an HIA may not be able to incorporate engineering or economic specifications for alternate routes for a proposed highway, it could discuss factors that would influence health outcomes, such as indicating that a desirable route would be, for example, 100 m from any school or elderly facility or would not be proximate to high-population-density areas with a number of vulnerable people. It would then fall to the decision-makers to determine routes that met those criteria.

        Outputs of Scoping

        On the basis of its review of current guidance and practice, the committee recommends that scoping should result in a framework for the HIA and a written project plan that includes the following:

        •   An initial brief summary of the pathways through which health could be affected and the health effects to be addressed, including a rationale for how the effects were chosen and an account of any potential health effects that were considered but were not selected and why. Any logic models or scoping tables that were completed should also be included.
        •   Identification of the population and vulnerable groups—such as children, the elderly, racial or ethnic minorities, low-income people, and communities—that are likely to be affected.

        •   A description of the research questions, data sources, methods to be used, and any alternatives to be assessed.

        •   Identification of apparent data gaps and of data collection that could be undertaken to address the gaps or a rationale for not undertaking data collection.

        •   A summary of how stakeholders were engaged, the main issues that the stakeholders raised, and how they will be addressed or why they will not be addressed.

        Committee Conclusions Regarding Scoping

        The credibility and relevance of HIA to the decision-making process rest on a balanced and complete examination of the health risks, benefits, and tradeoffs presented by the project, policy, program, or plan being assessed. For that reason, it is important that scoping begin with a systematic consideration of all potential effects rather than limiting consideration to a subset of issues predetermined by the team’s research interests or regulatory requirements. Conversely, to have the greatest relevance as an informational and planning document and to ensure judicious use of resources, the HIA should ultimately focus on the health effects of greatest potential importance. Therefore, scoping should be thought of as a two-part process that starts with a systematic effort to identify all potentially important effects and that continues with selection of the most important and well-substantiated effects for further analysis at later stages.

        Characteristics unique to the affected community may not be obvious to HIA practitioners who are outside the community. Stakeholders, however, may have insights into local conditions and potential solutions for addressing concerns raised by the proposal under consideration. Scoping should therefore entail a deliberative process that involves engagement of stakeholders. Review of literature and a consideration of the social, economic, and political context of the eventual decision are also important. In selecting the analytic methods that will be used, the HIA practitioner should consider not only technical limitations but what type of information will be most useful to decision-makers.

        Finally, it is appropriate to include issues that are the subject of community concern even if they seem unlikely to be substantiated by further analysis. An HIA does not have to accept community concern uncritically. If the HIA is based on a thorough analysis, provides complete information so that community members are able to critique the analysis, and is conducted openly, it may provide reassurance to affected communities even if the conclusions do not support the community’s concerns.


  1. https://timeline.com/warren-county-dumping-race-4d8fe8de06cb
  2. Enter your footnote content here.
  3. https://www.un.org/sustainabledevelopment/sustainable-development-goals/
  4. https://asq.org/quality-resources/iso-14001
  5. https://ctb.ku.edu/en/table-of-contents/overview/models-for-community-health-and-development/logic-model-development/main
  6. https://ctb.ku.edu/en/table-of-contents/overview/models-for-community-health-and-development/logic-model-development/main
  7. https://www.cdc.gov/healthyplaces/hia.htm
  8. https://ctb.ku.edu/en/table-of-contents/overview/models-for-community-health-and-development/logic-model-development/main

License

230 Introduction to Environmental Health Copyright © by thomasturco. All Rights Reserved.

Share This Book