Want to create or adapt books like this? Learn more about how Pressbooks supports open publishing practices.
9 Chapter 9 – Environmental Diseases and Air Quality
Environmental Diseases
What was the Human Genome Project?
The Human Genome Project was a large, well-organized, and highly collaborative international effort that generated the first sequence of the human genome and that of several additional well-studied organisms. Carried out from 1990–2003, it was one of the most ambitious and important scientific endeavors in human history.
What were the goals of the Human Genome Project?
A special committee of the U.S. National Academy of Sciences outlined the original goals for the Human Genome Project in 1988, which included sequencing the entire human genome in addition to the genomes of several carefully selected non-human organisms.
Eventually the list of organisms came to include the bacterium E. coli, baker’s yeast, fruit fly, nematode and mouse. The project’s architects and participants hoped the resulting information would usher in a new era for biomedical research, and its goals and related strategic plans were updated periodically throughout the project.
In part due to a deliberate focus on technology development, the Human Genome Project ultimately exceeded its initial set of goals, by developing the full sequencing in April 2003, two years ahead of its originally projected 2005 completion. Many of the project’s achievements were beyond what scientists thought possible in 1988.
What is DNA sequencing? How was it performed during the Human Genome Project?
DNA sequencing involves determining the exact order of the bases in DNA — the As, Cs, Gs and Ts that make up segments of DNA. Because the Human Genome Project aimed to sequence all of the DNA (i.e., the genome) of a set of organisms, significant effort was made to improve the methods for DNA sequencing.
Ultimately, the project used one particular method for DNA sequencing, called Sanger DNA sequencing, but first greatly advanced this basic method through a series of major technical innovations.
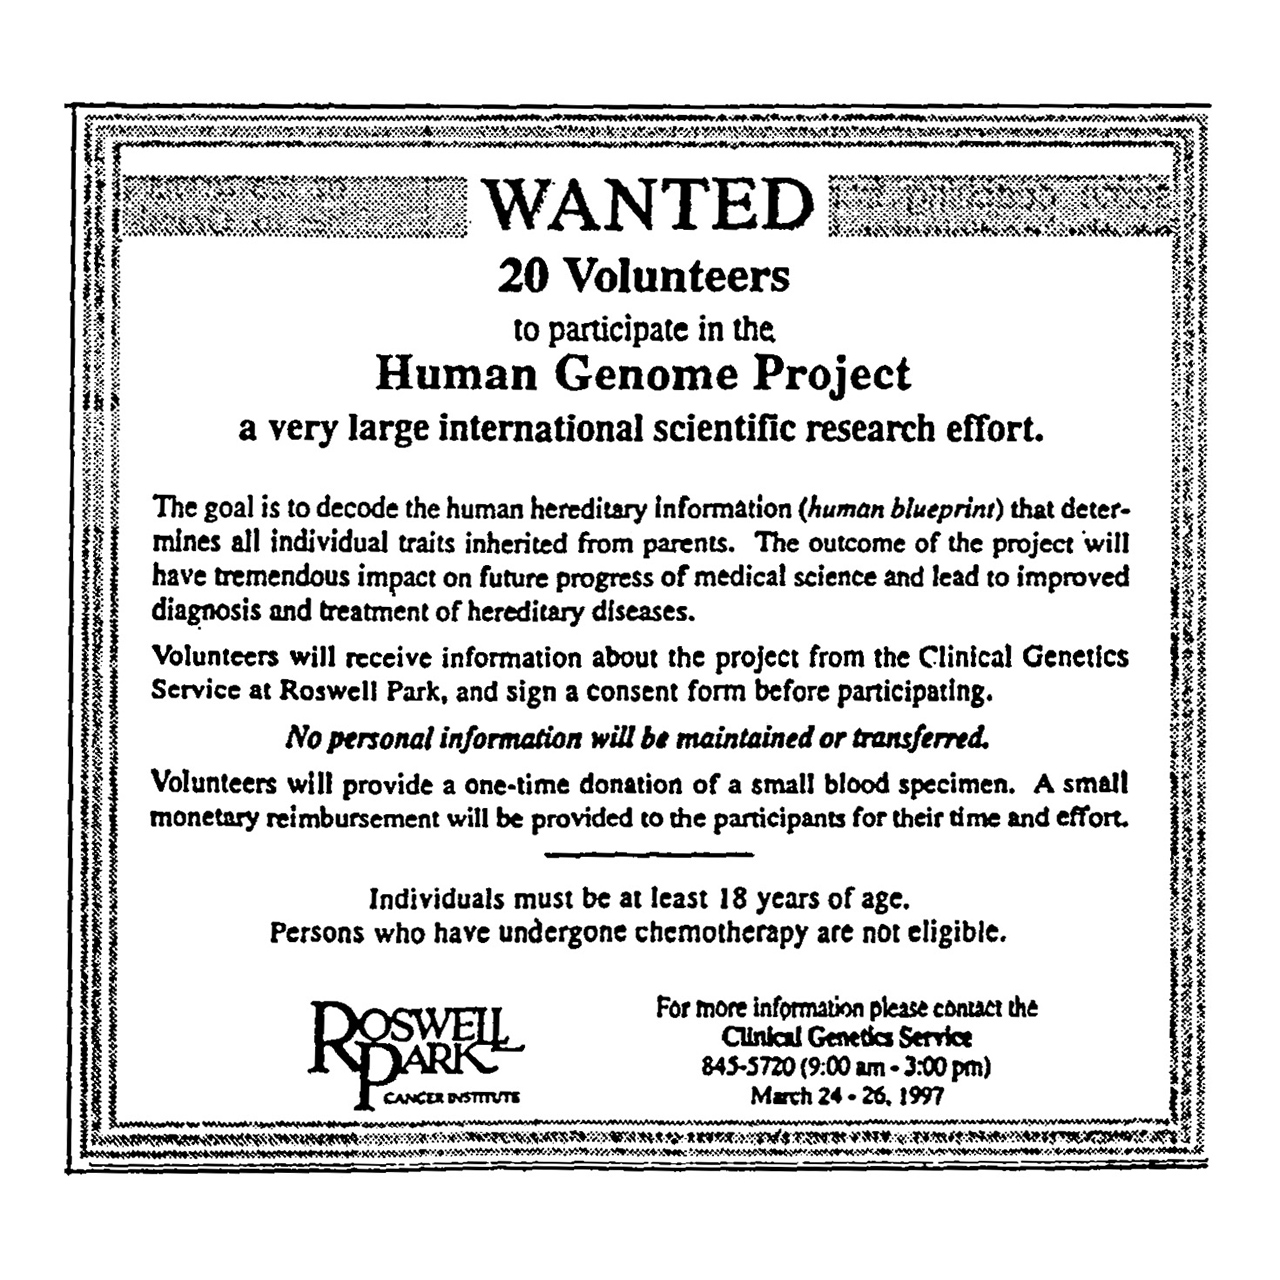
Photo: A 1997 Buffalo, New York newspaper advertisement recruiting volunteers to provide blood samples and DNA for the Human Genome Project. (NHGRI History of Genomics Program Archive)
Whose DNA was sequenced by the Human Genome Project? How was it collected?
The sequence of the human genome generated by the Human Genome Project was not from a single person. Rather, it reflects a patchwork from multiple people whose identities were intentionally made anonymous to protect their privacy.
The project researchers used a thoughtful process to recruit volunteers, acquire their informed consent, and collect their blood samples. Most of the human genome sequence generated by the Human Genome Project came from blood donors in Buffalo, New York; specifically, 93% from 11 donors, and 70% from one donor.
Who carried out the Human Genome Project?
The Human Genome Project could not have been completed as quickly and effectively without the dedicated participation of an international consortium of thousands of researchers. In the United States, the researchers were funded by the Department of Energy and the National Institutes of Health, which created the Office for Human Genome Research in 1988 (later renamed the National Center for Human Genome Research in 1990 and then the National Human Genome Research Institute in 1997).
The sequencing of the human genome involved researchers from 20 separate universities and research centers across the United States, United Kingdom, France, Germany, Japan and China. The groups in these countries became known as the International Human Genome Sequencing Consortium.
Photo: Researcher at Washington University in St. Louis handling frozen clones containing human DNA being studied by Human Genome Project researchers. (NHGRI Photo Archive)
How much did the Human Genome Project cost?
The initially projected cost for the Human Genome Project was $3 billion, based on its envisioned length of 15 years. While precise cost-accounting was difficult to carry out, especially across the set of international funders, most agree that this rough amount is close to the accurate number.
The cost of the Human Genome Project, while in the billions of dollars, has been greatly offset by the positive economic benefits that genomics has yielded in the ensuing decades. Such economic gains reflect direct links between resulting products and advances in the pharmaceutical and biotechnology industries, among others.
Did the Human Genome Project produce a perfectly complete genome sequence?
No. Throughout the Human Genome Project, researchers continually improved the methods for DNA sequencing. However, they were limited in their abilities to determine the sequence of some stretches of human DNA (e.g., particularly complex or highly repetitive DNA).
In June 2000, the International Human Genome Sequencing Consortium announced that it had produced a draft human genome sequence that accounted for 90% of the human genome. The draft sequence contained more than 150,000 areas where the DNA sequence was unknown because it could not be determined accurately (known as gaps).
In April 2003, the consortium announced that it had generated an essentially complete human genome sequence, which was significantly improved from the draft sequence. Specifically, it accounted for 92% of the human genome and less than 400 gaps; it was also more accurate.
On March 31, 2022, the Telomere-to-Telomere (T2T) consortium announced that had filled in the remaining gaps and produced the first truly complete human genome sequence.
How did the Human Genome Project change practices around data sharing in the scientific research community?
Human Genome Project scientists made every part of the draft human genome sequence publicly available shortly after production.
This routine came from two meetings in Bermuda in which project researchers agreed to the “Bermuda Principles,” which set out the rules for the rapid release of sequence data. This landmark agreement has been credited with establishing a greater awareness and openness to the sharing of data in biomedical research, making it one of the most important legacies of the Human Genome Project.
The first International Strategy Meeting on Human Genome Sequencing in Bermuda 1996. Nobelist James Watson,
How did the Human Genome Project foster ethics in biological research?
The leaders of the Human Genome Project recognized the need to be proactive in addressing a wide range of ethical and social issues related to the acquisition and use of genomic information. They were especially aware of the potential risks and benefits of incorporating new genomic knowledge into research and medicine. Similarly, they were aware of the potential misuse of genomic information when it came to insurance and employment, among others.
To help understand and address these issues, NHGRI established the Ethical, Legal, and Social Implications (ELSI) Research Program in 1990.
The early appreciation of the value of this program later led the U.S. Congress to mandate that NHGRI dedicate at least 5% of its research budget to studying the ethical, legal and social implications of genomic advances. The NHGRI ELSI Research Program has become a model for bioethics research worldwide.
How did the Human Genome Project affect biological research in general?
The Human Genome Project demonstrated that production-oriented, discovery-driven scientific inquiry — which did not involve the investigation of a specific hypothesis or the direct answering of preformed questions — could be remarkably valuable and beneficial to the broader scientific community.
The project was also a successful example of “big science” in biomedical research. The magnitude of the technological challenges prompted the Human Genome Project to assemble interdisciplinary groups from across the world, involving experts in engineering, biology, and computer science, among other areas. It also required the work to be concentrated in a modest number of major centers to maximize economies of scale.
Before the Human Genome Project, the biomedical research community viewed projects of such scale with deep skepticism. These kinds of massive scientific undertakings have become more commonplace and well-accepted based in part on the success of the Human Genome Project.[1]
Recombinant DNA technology
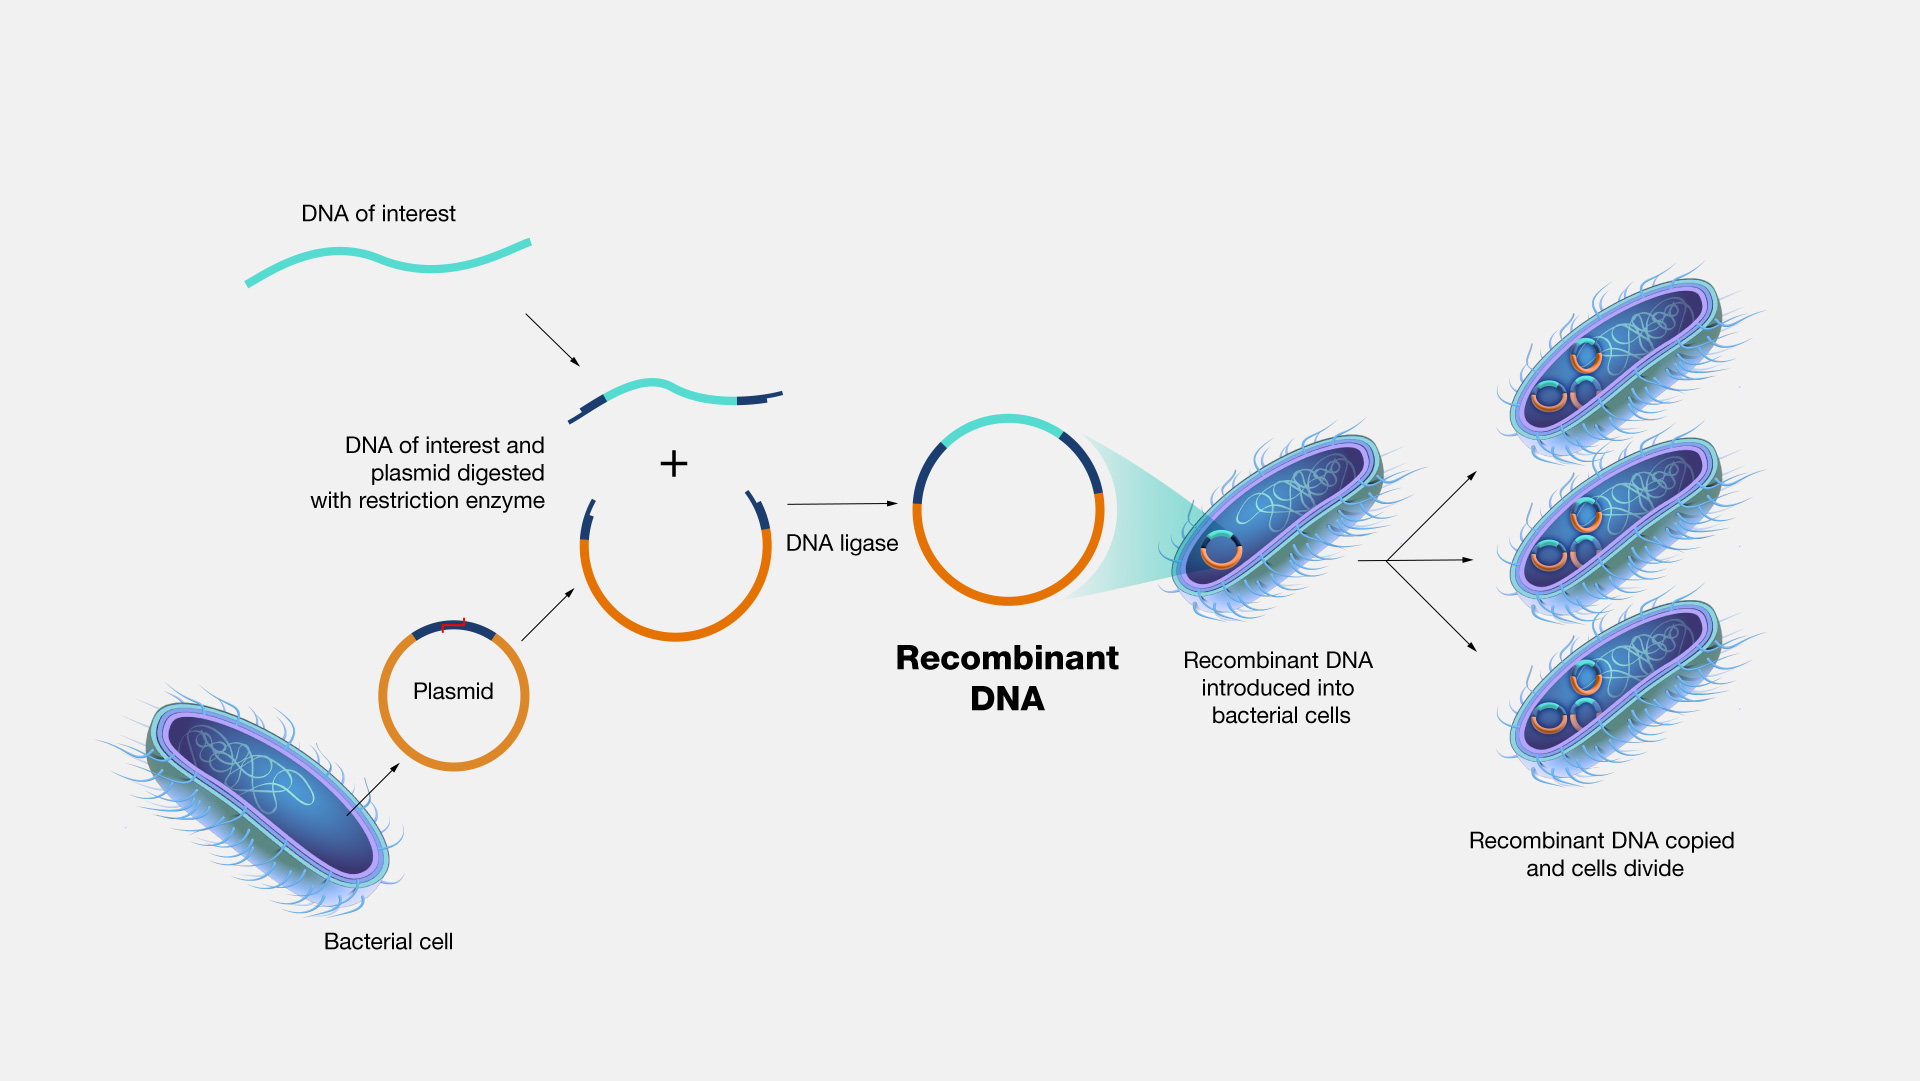
Recombinant DNA technology involves using enzymes and various laboratory techniques to manipulate and isolate DNA segments of interest. This method can be used to combine (or splice) DNA from different species or to create genes with new functions. The resulting copies are often referred to as recombinant DNA. Such work typically involves propagating the recombinant DNA in a bacterial or yeast cell, whose cellular machinery copies the engineered DNA along with its own.
Recombinant DNA Technology. Recombinant DNA technology is an extremely important research tool in biology. It allows scientists to manipulate DNA fragments in order to study them in the lab. It involves using a variety of laboratory methods to put a piece of DNA into a bacterial or yeast cell. Once in, the bacteria or yeast will copy the DNA along with its own. Recombinant DNA technology has been successfully applied to make important proteins used in the treatment of human diseases, such as insulin and growth hormone.[2]
REPERCUSSIONS: Downwinders
“DOWNWINDERS” ARE INDIVIDUALS living within the pathway of radioactive emissions from a nuclear plant or atomic bomb test site. According to the Washington State Department of Health Hanford Website, nearly 2 million individuals were exposed to a total of 237 varying radionuclides released into the air pathway or through the Columbia River pathway from 1944 to 1972. [1] Tom Bailie, who as a child grew up and continues to live on a farm near Hanford today, spoke to a Congressional Advisory Committee in 1994 showing a map he called “death mile” where “100 percent of those families drank the water, drank the milk, ate the food, have one common denominator that binds us together, and that is thyroid problems, handicapped children or cancer.” [2]
Radiation exposure occurs from either an internal source (alpha and beta radiation) or an external source (gamma and x-ray radiation) or a combination of both. Both sources have the potential to directly harm cells. With any radiation exposure one of four things can happen; one, radiation can pass through the cell without causing any harm; two, it may damage the cell with the cell repairing itself before producing new ones; three, it may damage the cell with the mutation passed on to new cells and four, it will simply kill the cell. [3] When cell damage is passed to on new cells a delayed health effect may occur including cancer and/or genetic effects. Diseases may appear within months, years, or decades with susceptibility dependent on individualized factors such as heredity. Although it is controversial whether low-dose radiation causes cancer a widely-known report published in 1990 by the Fifth Committee on the Biological Effects of Ionizing Radiation (BEIR V) concluded that “information from scientific studies about people receiving low doses was sufficient to determine cancer risk” and that “cancer risk from radiation exposure is higher than regulatory and advisory groups had previously described.” [4]
To understand how Hanford radiation releases affected the downwind population in particular, the Hanford Dose Reconstruction Project (HEDR) was initiated in 1987 and completed in 1995 to define the radiation dose estimate of people living near Hanford between 1944-1972. Originally established by the U.S. Department of Energy (DOE), the project was turned over to the Federal Centers for Disease Control (CDC) in 1992 when the public perceived the DOEs involvement as a conflict of interest.
The term “dose” refers to quantity of radiation or energy absorbed by the body. Dose is measured in rad, millirad, gray, or milligray. Dose differs from exposure in that it takes into account that some radiation entering the body will be flushed out or expelled through normal biological functions such as breathing or urination. The highest radiation dose originating from the air pathway at Hanford occurred during 1944 -1957. Iodine-131 was the largest airborne component with cerium-144, plutonium-239, ruthenium-103, ruthenium-106, and strontium-90 contributing in lower amounts. [5] The highest radiation dose originating from the Columbia River occurred during 1950 -1971. Phosphorus-32 was the largest component of the Columbia River pathway with zinc-65, arsenic-76, neptunium-239, and sodium-24 present in lower amounts. [6] Factors contributing to the Hanford dose include whether a person consumed contaminated milk, fruit, berries, or leafy vegetables, or if they ate radioactively contaminated fish or shellfish, drank contaminated Columbia River water, and/or whether they participated in recreational water activities such as swimming or boating in the Columbia near the facility. The distance or direction a person lived from the Hanford during an active radioactive release plus the length of time spent in a contaminated area also contributed to the overall dose. Age and gender are also taken into account as well as the individual’s food consumption rate, weight, metabolism, and weight of their organs to determine dose radiation exposure. For instance, children and teenagers concentrate more iodine in the thyroid gland than do adults. [7] Not everyone living within the estimated pathway (covering the entire area of eastern Washington into Oregon, Idaho, Canada, and as far east as Montana) received the same radiation dose or became ill from the exposure. Those who did become ill often feel that their illnesses were a direct result of the Hanford radioactive releases.
In 1988, after formally classified documents relating to Hanford production activities confirmed that copious amounts of radioiodine were released into the area’s atmosphere over a forty-year period, a thyroid study was launched to determine whether the residents living near Hanford from 1944 through 1957 were more susceptible to thyroid cancers and disease than an unexposed population. A controversial study conducted by the Fred Hutchinson Cancer Research Center and administered by the U.S. Centers for Disease Control and Prevention for over $20 million was released in 2002. The Hanford Thyroid Disease Study (HTDS) examined 5,199 people identified from birth records during 1940-46 to mothers who lived in one of seven affected counties in Washington State. The draft released in 1999 was regarded as highly suspect by much of the public including some of the review panel scientists due to the fact that it entirely discounted any evidence of thyroid cancer or disease within the Hanford study population. Due to negative draft report critiques, the HTDS researchers sought an external, third-party review. This external review board “re-evaluated the data and corrected errors in some of the dose estimates as well as characterizations of statistical certainty.” [8] In June 2002, the final HTDS report announced “the findings do not prove that Hanford radiation had no effect on the health of the area population…if there is an increased risk of thyroid disease from exposure to Iodine-131, it is probably too small to observe…”
Understandably many former Hanford employees and area residents are extremely disappointed with the final HTDS statistical generalizations. In an article dated June 22nd, 2002 the Seattle Times shared a story of a woman whose father worked was an engineer at Hanford from1947 to 1953. Having lived downwind from the facility as a child, her illnesses include “cancer of the lip and salivary gland…tumors in her sinuses, hypothyroidism, and auto-immune problems.” [9] Ray Samsom, an electrician who worked at Hanford in 1974 was exposed to radioactivity when a sliver of radioactive graphite lodged in his nostril after changing overhead light bulbs. Now suffering an aggressive form of skin cancer in this same nostril, he has had to date five operations to cut out cancerous tissues and is scheduled for another to reconstruct his now disfigured nose. [10]
Even more alarming is the fact that former employees like Samson involved in litigation find it difficult to get their cases considered. With early work paper records difficult to locate, many claimants have not been able to confirm their actual Hanford employment. Of the 4,100 claims from former federal nuclear workers (1,200 from Washington) only 85 people have received final approval for compensation (no former Hanford employees were included in this group). [11] Litigation concerning the general public in the matter has been a slow, arduous process. Thousands of Downwinders are still waiting to have their cases heard and some will become ill or will die in the mean time from diseases largely suspected to have resulted from historic Hanford radioactive releases.[3]
Vector-borne diseases account for more than 17% of all infectious diseases, causing more than 700 000 deaths annually. They can be caused by either parasites, bacteria or viruses.
Malaria is a parasitic infection transmitted by Anopheline mosquitoes. It causes an estimated 219 million cases globally, and results in more than 400,000 deaths every year. Most of the deaths occur in children under the age of 5 years.
Dengue is the most prevalent viral infection transmitted by Aedes mosquitoes. More than 3.9 billion people in over 129 countries are at risk of contracting dengue, with an estimated 96 million symptomatic cases and an estimated 40,000 deaths every year.
Other viral diseases transmitted by vectors include chikungunya fever, Zika virus fever, yellow fever, West Nile fever, Japanese encephalitis (all transmitted by mosquitoes), tick-borne encephalitis (transmitted by ticks).
Many of vector-borne diseases are preventable, through protective measures, and community mobilisation.
Vectors
Vectors are living organisms that can transmit infectious pathogens between humans, or from animals to humans. Many of these vectors are bloodsucking insects, which ingest disease-producing microorganisms during a blood meal from an infected host (human or animal) and later transmit it into a new host, after the pathogen has replicated. Often, once a vector becomes infectious, they are capable of transmitting the pathogen for the rest of their life during each subsequent bite/blood meal.
Vector-borne diseases
Vector-borne diseases are human illnesses caused by parasites, viruses and bacteria that are transmitted by vectors. Every year there are more than 700,000 deaths from diseases such as malaria, dengue, schistosomiasis, human African trypanosomiasis, leishmaniasis, Chagas disease, yellow fever, Japanese encephalitis and onchocerciasis.
The burden of these diseases is highest in tropical and subtropical areas, and they disproportionately affect the poorest populations. Since 2014, major outbreaks of dengue, malaria, chikungunya, yellow fever and Zika have afflicted populations, claimed lives, and overwhelmed health systems in many countries. Other diseases such as Chikungunya, leishmaniasis and lymphatic filariasis cause chronic suffering, life-long morbidity, disability and occasional stigmatisation.
Distribution of vector-borne diseases is determined by a complex set of demographic, environmental and social factors. Global travel and trade, unplanned urbanization, and en
List of vector-borne diseases, according to their vectorThe following table is a non-exhaustive list of vector-borne disease, ordered according to the vector by which it is transmitted. The list also illustrates the type of pathogen that causes the disease in humans.
Vector
Disease caused
Type of pathogen
Mosquito
Aedes
Chikungunya
Dengue
Lymphatic filariasis
Rift Valley fever
Yellow Fever
Zika
Virus
Virus
Parasite
Virus
Virus
Virus
Anopheles
Lymphatic filariasis
Malaria
Parasite
Parasite
Culex
Japanese encephalitis
Lymphatic filariasis
West Nile fever
Virus
Parasite
Virus
Aquatic snails
Schistosomiasis (bilharziasis)
Parasite
Blackflies
Onchocerciasis (river blindness)
Parasite
Fleas
Plague (transmitted from rats to humans)
Tungiasis
Bacteria
Ectoparasite
Lice
Typhus
Louse-borne relapsing fever
Bacteria
Bacteria
Sandflies
Leishmaniasis
Sandfly fever (phlebotomus fever)
Parasite
Virus
Ticks
Crimean-Congo haemorrhagic fever
Lyme disease
Relapsing fever (borreliosis)
Rickettsial diseases (eg: spotted fever and Q fever)
Tick-borne encephalitis
Tularaemia
Virus
Bacteria
Bacteria
Bacteria
Virus
Bacteria
Triatome bugs
Chagas disease (American trypanosomiasis)
Parasite
Tsetse flies
Sleeping sickness (African trypanosomiasis)
Parasite
Air Pollution
Atmospheric Composition
Understanding Atmospheric Composition is both simple and handy in understanding how mankind can influence climate. Many people think the atmosphere is just too big for humans to influence? It sounds like a reasonable statement, until you realize that you don’t need to change the whole atmosphere to change climate… you just need to change a little bit of it.
Atmospheric Composition
With no understanding of the atmosphere and it’s composition, it is easy to see why someone might question how we could change the climate. The atmosphere is really big. But to get this in perspective, you really only need to know how much of the atmosphere keeps us warm.
Generally speaking, looking at the pre-industrial atmosphere, if you don’t consider water vapor (a larger variable gas), the atmosphere is about 78% Nitrogen and 21% Oxygen. So, 99% of the atmosphere is accounted for in those two gases. The last one percent includes various trace gases, some are greenhouse gases, and some are not.
To get that in perspective, think about it like this. the natural greenhouse gases are CO2, H2O, CH4, and N2O. These gases comprise less than 300ths of a percent of our pre-industrial atmosphere. Then of course add water and stir 🙂
If it were not for that tiny fraction of greenhouse gases, in our atmosphere, Earth would be a giant frozen ball in space. It’s as simple as that.
Once you understand that you don’t need to change the whole atmosphere but rather you need only change a tiny fraction to change the climate or climate forcing… It becomes much easier to understand how industrial emissions can have an impact on the climate of the planet. Keep in mind that our pre-industrial atmosphere only needed, other than H2O approximately 300th’s of a percent of the atmosphere to contain GHG’s in order to keep Earth relatively warm. Changing CO2 concentration from 280ppm to approximate 400ppm is a significant increase. Now, other than H2O, nearly 400th’s of a percent of our atmosphere contains greenhouse gases. Of all the GHG’s CO2 is a more significant component because of it’s atmospheric lifetime and the associated warming ability that goes along with this particular gas, which changes the amount of heat energy trapped within our climate system.
Table 7a-1: Average estimated composition of the atmosphere up to an altitude of 25 km (*+/- 0.5%).
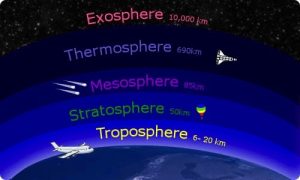
Troposphere
The troposphere starts at the Earth’s surface and extends 8 to 14.5 kilometers high (5 to 9 miles). This part of the atmosphere is the most dense. Almost all weather is in this region.
Stratosphere
The stratosphere starts just above the troposphere and extends to 50 kilometers (31 miles) high. The ozone layer, which absorbs and scatters the solar ultraviolet radiation, is in this layer.
Mesosphere
The mesosphere starts just above the stratosphere and extends to 85 kilometers (53 miles) high. Meteors burn up in this layer
Thermosphere
The thermosphere starts just above the mesosphere and extends to 600 kilometers (372 miles) high. Aurora and satellites occur in this layer.
Ionosphere
The ionosphere is an abundant layer of electrons and ionized atoms and molecules that stretches from about 48 kilometers (30 miles) above the surface to the edge of space at about 965 km (600 mi), overlapping into the mesosphere and thermosphere. This dynamic region grows and shrinks based on solar conditions and divides further into the sub-regions: D, E and F; based on what wavelength of solar radiation is absorbed. The ionosphere is a critical link in the chain of Sun-Earth interactions. This region is what makes radio communications possible.
Exosphere
This is the upper limit of our atmosphere. It extends from the top of the thermosphere up to 10,000 km (6,200 mi).[7]
Ozone Basics
Ozone is very rare in our atmosphere, averaging about three molecules of ozone for every 10 million air molecules. In spite of this small amount, ozone plays a vital role in the atmosphere. In the information below, we present “the basics” about this important component of the Earth’s atmosphere.
Where is ozone found in the atmosphere?
Ozone is mainly found in two regions of the Earth’s atmosphere. Most ozone (about 90%) resides in a layer that begins between 6 and 10 miles (10 and 17 kilometers) above the Earth’s surface and extends up to about 30 miles (50 kilometers). This region of the atmosphere is called the stratosphere. The ozone in this region is commonly known as the ozone layer. The remaining ozone is in the lower region of the atmosphere, which is commonly called the troposphere. The figure (above) shows an example of how ozone is distributed in the atmosphere.
What roles does ozone play in the atmosphere and how are humans affected?
The ozone molecules in the upper atmosphere (stratosphere) and the lower atmosphere (troposphere) are chemically identical, because they all consist of three oxygen atoms and have the chemical formula O3. However, they have very different roles in the atmosphere and very different effects on humans and other living beings. Stratospheric ozone (sometimes referred to as “good ozone”) plays a beneficial role by absorbing most of the biologically damaging ultraviolet sunlight (called UV-B), allowing only a small amount to reach the Earth’s surface. The absorption of ultraviolet radiation by ozone creates a source of heat, which actually forms the stratosphere itself (a region in which the temperature rises as one goes to higher altitudes). Ozone thus plays a key role in the temperature structure of the Earth’s atmosphere. Without the filtering action of the ozone layer, more of the Sun’s UV-B radiation would penetrate the atmosphere and would reach the Earth’s surface. Many experimental studies of plants and animals and clinical studies of humans have shown the harmful effects of excessive exposure to UV-B radiation.
At the Earth’s surface, ozone comes into direct contact with life-forms and displays its destructive side (hence, it is often called “bad ozone”). Because ozone reacts strongly with other molecules, high levels of ozone are toxic to living systems. Several studies have documented the harmful effects of ozone on crop production, forest growth, and human health. The substantial negative effects of surface-level tropospheric ozone from this direct toxicity contrast with the benefits of the additional filtering of UV-B radiation that it provides.
What are the environmental issues associated with ozone? The dual role of ozone leads to two separate environmental issues. There is concern about increases in ozone in the troposphere. Near-surface ozone is a key component of photochemical “smog,” a familiar problem in the atmosphere of many cities around the world. Higher amounts of surface-level ozone are increasingly being observed in rural areas as well.
There is also widespread scientific and public interest and concern about losses of ozone in the stratosphere. Ground-based and satellite instruments have measured decreases in the amount of stratospheric ozone in our atmosphere. Over some parts of Antarctica, up to 60% of the total overhead amount of ozone (known as the column ozone) is depleted during Antarctic spring (September-November). This phenomenon is known as the Antarctic ozone hole. In the Arctic polar regions, similar processes occur that have also led to significant chemical depletion of the column ozone during late winter and spring in 7 out of the last 11 years. The ozone loss from January through late March has been typically 20-25%, and shorter-period losses have been higher, depending on the meteorological conditions encountered in the Arctic stratosphere. Smaller, but still significant, stratospheric decreases have been seen at other, more-populated regions of the Earth. Increases in surface UV-B radiation have been observed in association with local decreases in stratospheric ozone, from both ground-based and satellite-borne instruments.
What human activities affect upper-atmospheric ozone (the stratospheric ozone layer)?
The scientific evidence, accumulated over more than two decades of study by the international research community, has shown that human-produced chemicals are responsible for the observed depletions of the ozone layer. The ozone-depleting compounds contain various combinations of the chemical elements chlorine, fluorine, bromine, carbon, and hydrogen and are often described by the general term halocarbons. The compounds that contain only chlorine, fluorine, and carbon are called chlorofluorocarbons, usually abbreviated as CFCs. CFCs, carbon tetrachloride, and methyl chloroform are important human-produced ozone-depleting gases that have been used in many applications including refrigeration, air conditioning, foam blowing, cleaning of electronics components, and as solvents. Another important group of human-produced halocarbons is the halons, which contain carbon, bromine, fluorine, and (in some cases) chlorine and have been mainly used as fire extinguishants.
What actions have been taken to protect the ozone layer?
Through an international agreement known as the Montreal Protocol on Substances that Deplete the Ozone Layer, governments have decided to eventually discontinue production of CFCs, halons, carbon tetrachloride, and methyl chloroform (except for a few special uses), and industry has developed more “ozone-friendly” substitutes. All other things being equal, and with adherence to the international agreements, the ozone layer is expected to recover over the next 50 years or so.[8]
Solar radiation, often called the solar resource or just sunlight, is a general term for the electromagnetic radiation emitted by the sun. Solar radiation can be captured and turned into useful forms of energy, such as heat and electricity, using a variety of technologies. However, the technical feasibility and economical operation of these technologies at a specific location depends on the available solar resource.
Solar Radiation Basics
Every location on Earth receives sunlight at least part of the year. The amount of solar radiation that reaches any one spot on the Earth’s surface varies according to:
Geographic location
Time of day
Season
Local landscape
Local weather.
Because the Earth is round, the sun strikes the surface at different angles, ranging from 0° (just above the horizon) to 90° (directly overhead). When the sun’s rays are vertical, the Earth’s surface gets all the energy possible. The more slanted the sun’s rays are, the longer they travel through the atmosphere, becoming more scattered and diffuse. Because the Earth is round, the frigid polar regions never get a high sun, and because of the tilted axis of rotation, these areas receive no sun at all during part of the year.
The Earth revolves around the sun in an elliptical orbit and is closer to the sun during part of the year. When the sun is nearer the Earth, the Earth’s surface receives a little more solar energy. The Earth is nearer the sun when it is summer in the southern hemisphere and winter in the northern hemisphere. However, the presence of vast oceans moderates the hotter summers and colder winters one would expect to see in the southern hemisphere as a result of this difference.
The 23.5° tilt in the Earth’s axis of rotation is a more significant factor in determining the amount of sunlight striking the Earth at a particular location. Tilting results in longer days in the northern hemisphere from the spring (vernal) equinox to the fall (autumnal) equinox and longer days in the southern hemisphere during the other 6 months. Days and nights are both exactly 12 hours long on the equinoxes, which occur each year on or around March 23 and September 22.
Countries such as the United States, which lie in the middle latitudes, receive more solar energy in the summer not only because days are longer, but also because the sun is nearly overhead. The sun’s rays are far more slanted during the shorter days of the winter months. Cities such as Denver, Colorado, (near 40° latitude) receive nearly three times more solar energy in June than they do in December.
The rotation of the Earth is also responsible for hourly variations in sunlight. In the early morning and late afternoon, the sun is low in the sky. Its rays travel further through the atmosphere than at noon, when the sun is at its highest point. On a clear day, the greatest amount of solar energy reaches a solar collector around solar noon.
Diffuse and Direct Solar Radiation
As sunlight passes through the atmosphere, some of it is absorbed, scattered, and reflected by:
Air molecules
Water vapor
Clouds
Dust
Pollutants
Forest fires
Volcanoes.
This is called diffuse solar radiation. The solar radiation that reaches the Earth’s surface without being diffused is called direct beam solar radiation. The sum of the diffuse and direct solar radiation is called global solar radiation. Atmospheric conditions can reduce direct beam radiation by 10% on clear, dry days and by 100% during thick, cloudy days.
Measurement
Scientists measure the amount of sunlight falling on specific locations at different times of the year. They then estimate the amount of sunlight falling on regions at the same latitude with similar climates. Measurements of solar energy are typically expressed as total radiation on a horizontal surface,or as total radiation on a surface tracking the sun.
Radiation data for solar electric (photovoltaic) systems are often represented as kilowatt-hours per square meter (kWh/m2). Direct estimates of solar energy may also be expressed as watts per square meter (W/m2).
Radiation data for solar water heating and space heating systems are usually represented in British thermal units per square foot (Btu/ft2).
Distribution
The solar resource across the United States is ample for photovoltaic (PV) systems because they use both direct and scattered sunlight. Other technologies may be more limited. However, the amount of power generated by any solar technology at a particular site depends on how much of the sun’s energy reaches it. Thus, solar technologies function most efficiently in the southwestern United States, which receives the greatest amount of solar energy.[9]
For this discussion, you will look at the potential feasibility of the state of California implementing a ban on internal combustion engines. You will then compose a response to several posts and share it with your group on a discussion forum.
Pre-Discussion Work
To begin this assignment, review the following resources:
Next, prepare your forum post by creating a Google document. On your document, answer the following questions:
Do you believe that such an action is good public policy? Explain.
Do you believe that such a ban would be effective in reducing air pollution in California? Explain.
Given that there are so many cars sold in California, how might this impact the cars sold in the remainder of the United States?
What if, upon graduation, a high school student received a new car and it is still running well and he or she plans to keep it for a long, long time.There will be such cars in California when the ban becomes effective. The question is:
How long would this person be allowed to drive this car after the ban? Should they be forced to take it to the junkyard?
How do you believe California will deal with the legacy internal combustion engines?
Be sure to support your responses by referencing materials from this module. Also, once you have answered the questions, be sure to proofread what you wrote before you share it.
Discussing Your Work
To discuss your findings, follow the steps below:
Step 01. After you have finished writing and proofreading your response, click on the link to your group under the My Groups link in the main menu on the left side of this page.
Step 02. Once in your group, click on the Group Discussion Board link and locate the Module 05 Discussion Forum 1.
Step 03. In the Module 05 Discussion Forum 1, create a new thread and title it using the following format: Yourname’s Combustion Engine Ban Post.
Step 04. In the Message field of your post, copy and paste the text of your composition from the Google Document you created– please do not provide a link to that Google Doc.
Step 05. Correct the formatting using the text-editing tools in the Message field. Add bolding, underlining, or italics where necessary. Also, correct any spacing and other formatting issues. Make sure your post looks professional.
Step 06. When you have completed proofreading and fixing your post formatting, click on the Submit button.
Air pollution is a familiar environmental health hazard. We know what we’re looking at when brown haze settles over a city, exhaust billows across a busy highway, or a plume rises from a smokestack. Some air pollution is not seen, but its pungent smell alerts you.
It is a major threat to global health and prosperity. Air pollution, in all forms, is responsible for more than 6.5 million deaths each year globally, a number that has increased over the past two decades.
What Is Air Pollution?
Air pollution is a mix of hazardous substances from both human-made and natural sources.
Vehicle emissions, fuel oils and natural gas to heat homes, by-products of manufacturing and power generation, particularly coal-fueled power plants, and fumes from chemical production are the primary sources of human-made air pollution.
Nature releases hazardous substances into the air, such as smoke from wildfires, which are often caused by people; ash and gases from volcanic eruptions; and gases, like methane, which are emitted from decomposing organic matter in soils.
Traffic-Related Air Pollution (TRAP), a mixture of gasses and particles, has most of the elements of human-made air pollution: ground-level ozone, various forms of carbon, nitrogen oxides, sulfur oxides, volatile organic compounds, polycyclic aromatic hydrocarbons, and fine particulate matter.
Ozone, an atmospheric gas, is often called smog when at ground level. It is created when pollutants emitted by cars, power plants, industrial boilers, refineries, and other sources chemically react in the presence of sunlight.
Noxious gases, which include carbon dioxide, carbon monoxide, nitrogen oxides (NOx), and sulfur oxides (SOx), are components of motor vehicle emissions and byproducts of industrial processes.
Particulate matter (PM) is composed of chemicals such as sulfates, nitrates, carbon, or mineral dusts. Vehicle and industrial emissions from fossil fuel combustion, cigarette smoke, and burning organic matter, such as wildfires, all contain PM.
A subset of PM, fine particulate matter (PM 2.5) is 30 times thinner than a human hair. It can be inhaled deeply into lung tissue and contribute to serious health problems. PM 2.5 accounts for most health effects due to air pollution in the U.S.
Volatile organic compounds (VOC) vaporize at or near room temperature—hence, the designation volatile. They are called organic because they contain carbon. VOCs are given off by paints, cleaning supplies, pesticides, some furnishings, and even craft materials like glue. Gasoline and natural gas are major sources of VOCs, which are released during combustion.
Polycyclic aromatic hydrocarbons (PAH) are organic compounds containing carbon and hydrogen. Of more than 100 PAHs known to be widespread in the environment, 15 are listed in the Report on Carcinogens. In addition to combustion, many industrial processes, such as iron, steel, and rubber product manufacturing, as well as power generation, also produce PAHs as a by-product. PAHs are also found in particulate matter.
Air Pollution and Climate Change
Air pollution and climate change affect each other through complex interactions in the atmosphere. Air pollution is intricately linked with climate change because both problems come largely from the same sources, such as emissions from burning fossil fuels. Both are threats to people’s health and the environment worldwide.
How does air pollution affect our health?
When the National Ambient Air Quality Standards were established in 1970, air pollution was regarded primarily as a threat to respiratory health. In 1993, NIEHS researchers published the landmark Six Cities Study, which established an association between fine particulate matter and mortality.
Air pollution exposure is associated with oxidative stress and inflammation in human cells, which may lay a foundation for chronic diseases and cancer. In 2013, the International Agency for Research on Cancer of the World Health Organization (WHO) classified air pollution as a human carcinogen.
Research on air pollution and health effects continually advances. Public health concern now includes cancer, cardiovascular disease, respiratory diseases, diabetes mellitus, obesity, and reproductive, neurological, and immune system disorders
Cancer
A large study of more than 57,000 women found living near major roadways may increase a woman’s risk for breast cancer.
The NIEHS Sister Study found other airborne toxic substances, especially methylene chloride, which is used in aerosol products and paint removers, are also associated with increased risk of breast cancer.
Occupational exposure to benzene, an industrial chemical and component of gasoline, can cause leukemia and is associated with non-Hodgkin’s Lymphoma.
A long-term study, 2000-2016, found an association between lung cancer incidence and increased reliance on coal for energy generation.
Cardiovascular Disease
Fine particulate matter can impair blood vessel function and speed up calcification in arteries.
NIEHS researchers established links between short-term daily exposure by post-menopausal women to nitrogen oxides and increased risk of hemorrhagic stroke.
For some older Americans, exposure to TRAP can result in lowered levels of high-density lipoprotein, sometimes called good cholesterol, increasing their risk for cardiovascular disease.
According to a National Toxicology Program (NTP) report, TRAP exposure also increases a pregnant woman’s risk for dangerous changes in blood pressure, known as hypertensive disorders, which are a leading cause of pre-term birth, low birth weight, and maternal and fetal illness and death.
Respiratory Disease
Air pollution can affect lung development and is implicated in the development of emphysema, asthma, and other respiratory diseases, such as chronic obstructive pulmonary disease (COPD).
PM and nitrogen oxide are linked to chronic bronchitis.
In 2020, a major public health challenge was confluence of the COVID-19 pandemic and wildfires across the western U.S. Building on a well-established connection between air pollution and respiratory-tract infections, a study linked wildfire smoke with additional COVID-19 cases and deaths.
Whom does air pollution affect the most?
Air pollution affects everyone’s health, but certain groups may be harmed more.
Almost 9 out of 10 people who live in urban areas worldwide are affected by air pollution.
Children
The NIEHS-funded Children’s Health Study at the University of Southern California is one of the largest studies of the long-term effects of air pollution on children’s respiratory health. Among its findings:
Higher air pollution levels increase short-term respiratory infections, which lead to more school absences.
Children who play several outdoor sports and live in high ozone communities are more likely to develop asthma.
Children living near busy roads are at increased risk for asthma.
Children with asthma who were exposed to high levels of air pollutants were more likely to develop bronchitis symptoms.
Living in communities with higher pollution levels can cause lung damage.
Other studies on women and children
NIEHS-funded researchers from the University of California, Davis, Environmental Health Sciences Center are conducting the Bio-Specimen and Fire Effects (B-SAFE) Study. This ongoing project seeks to discover if and how recent wildfires and their smoke affected pregnant women and their babies. Begun in 2017, study participants are pregnant women who were living in Northern California when the 2018, 2019, or 2020 wildfires occurred there.
Breathing PM 2.5, even at relatively low levels, may alter the size of a child’s developing brain, which may ultimately increase the risk for cognitive and emotional problems later in adolescence.
Prenatal exposure to PAHs was associated with brain development effects, slower processing speed, attention-deficit and hyperactivity disorder (ADHD) symptoms, and other neurobehavioral problems in urban youth.
In New York City, prenatal exposure to air pollution may play a role in childhood ADHD-related behavior problems.
Prenatal exposure to particulate matter was associated with low birth weight.
Women exposed to high levels of fine particulate matter during pregnancy, particularly in the third trimester, may have up to twice the risk of having a child with autism.
Second and third trimester exposure to PM 2.5 might increase the chance of those children having high blood pressure in early life.
In California’s agricultural San Joaquin Valley, women who were exposed to high levels of carbon monoxide, nitrogen oxide, or nitrogen dioxide during their first 8 weeks of pregnancy were more likely to have a baby with neural tube defects.
In Marietta, Ohio, home to a ferromanganese refinery, manganese concentrations in blood and hair, a biomarker of air pollution exposure, were associated with lower child IQ scores.
Older adults
Alzheimer’s disease and related dementias are a public health challenge for aging populations. NIEHS-funded researchers at the University of Washington identified a link between air pollution and dementias. This well-conducted study adds considerable evidence that ambient air fine particles increase risk of dementias.
Air pollution was linked to a greater chance of developing several neurological disorders, including Parkinson’s disease, Alzheimer’s disease, and other dementias. Hospital admissions data from 63 million older adults in the U.S., obtained over 17 years (2000-2016), was analyzed along with estimated PM 2.5 concentrations by zip code to conduct the study.
In older adults, long-term exposure to TRAP may significantly hasten physical disabilities. The risk is more pronounced among racial minorities and lower-income people.
PM 2.5 air pollution is also associated with accelerated memory problems and Alzheimer’s-like brain declines, which was seen among women 65 years of age and older. Conversely, a multi-year study published in 2022 shows improved air quality is associated with lower risk of dementia in older women. The researchers also stated this decline in dementia risk was equivalent to taking nearly 2 1/2 years off the age of the women studied.
Nutrients may counter some harmful effects from air pollution. A 2020 study found omega-3 fatty acids, obtained by eating certain fish, may protect against PM 2.5-associated brain shrinkage in older women.
Rural dwellers
An NIEHS-funded study found that concentrations of PM 2.5 in rural Washington State were comparable to urban Seattle. In this study, as regional PM 2.5 increased, there were increased asthma symptoms, such as limitation of activities, more wheezing, and more nighttime waking, in rural children.
In the rural U.S., large-scale animal feeding operations might compromise regional air quality through emission of pollutants, such as ammonia gas. A study found acute lung function problems in children with asthma in such areas.
Different genes
Your genes play a role in respiratory health. NIEHS-funded research discovered that people with specific gene variants, which made them more likely to have lung inflammation, had a greater chance of suffering from asthma if they lived close to major roadways.[10]
World Health Organization Key Facts on Ambient Outdoor Air Pollution
Key facts
Air pollution is one of the greatest environmental risk to health. By reducing air pollution levels, countries can reduce the burden of disease from stroke, heart disease, lung cancer, and both chronic and acute respiratory diseases, including asthma.
The lower the levels of air pollution, the better the cardiovascular and respiratory health of the population will be, both long- and short-term.
The WHO Air Quality Guidelines: Global Update 2021 provide an assessment of health effects of air pollution and thresholds for health–harmful pollution levels.
In 2019, 99% of the world population was living in places where the WHO air quality guidelines levels were not met.
Ambient (outdoor air pollution) in both cities and rural areas was estimated to cause 4.2 million premature deaths worldwide in 2016.
Some 91% of those premature deaths occurred in low- and middle-income countries, and the greatest number in the WHO South-East Asia and Western Pacific regions.
Policies and investments supporting cleaner transport, energy-efficient homes, power generation, industry and better municipal waste management would reduce key sources of outdoor air pollution.
In addition to outdoor air pollution, indoor smoke is a serious health risk for some 2.4 billion people who cook and heat their homes with biomass, kerosene fuels and coal.
Crop Residue Burning
Crop residue is vegetative material remaining in the field after harvest. Burning crop residue in a controlled manner can improve crop yields, decrease herbicide and pesticide use, and control disease, weeds, and pests.
Idaho Department of Environmental Quality (DEQ)’s Crop Residue Burning (CRB) program is designed to protect public health while allowing growers to burn under certain conditions. The program is managed by DEQ on lands other than Indian reservations in Idaho. DEQ implements the CRB program for the Kootenai Tribe of Idaho through a Memorandum of Understanding.
Most agricultural burning requires a permit under DEQ’s CRB program.
DEQ ensures smoke from approved burns does not adversely impact institutions with sensitive populations, which includes public schools while in session, hospitals, residential health care facilities for children, the elderly or infirm, and other institutions with sensitive populations as approved by DEQ.
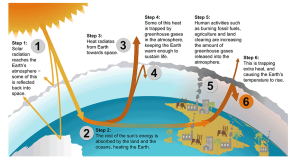
What is the greenhouse effect?
The greenhouse effect is the way in which heat is trapped close to Earth’s surface by “greenhouse gases.” These heat-trapping gases can be thought of as a blanket wrapped around Earth, keeping the planet toastier than it would be without them. Greenhouse gases include carbon dioxide, methane, nitrous oxides, and water vapor. (Water vapor, which responds physically or chemically to changes in temperature, is called a “feedback.”)Scientists have determined that carbon dioxide’s warming effect helps stabilize Earth’s atmosphere. Remove carbon dioxide, and the terrestrial greenhouse effect would collapse. Without carbon dioxide, Earth’s surface would be some 33°C (59°F) cooler. (Graphic https://courses.lumenlearning.com/suny-environmentalbiology/chapter/10-4-climate-change/)
Greenhouse gases occur naturally and are part of our atmosphere’s makeup. For that reason, Earth is sometimes called the “Goldilocks” planet – its conditions are not too hot and not too cold, but just right to allow life (including us) to flourish. Part of what makes Earth so amenable is its natural greenhouse effect, which keeps the planet at a friendly 15 °C (59 °F) on average. But in the last century or so, humans have been interfering with the planet’s energy balance, mainly through the burning of fossil fuels that add carbon dioxide to the air. The level of carbon dioxide in Earth’s atmosphere has been rising consistently for decades and traps extra heat near Earth’s surface, causing temperatures to rise.[11]
Earth’s Temperature is a Balancing Act
Earth’s temperature depends on the balance between energy entering and leaving the planet. When incoming energy from the sun is absorbed, Earth warms. When the sun’s energy is reflected back into space, Earth avoids warming. When energy is released back into space, Earth cools. Many factors, both natural and human, can cause changes in Earth’s energy balance, including:
Changes in the greenhouse effect, which affects the amount of heat retained by Earth’s atmosphere
Variations in the sun’s energy reaching Earth
Changes in the reflectivity of Earth’s atmosphere and surface
Scientists have pieced together a picture of Earth’s climate, dating back hundreds of thousands of years, by analyzing a number of indirect measures of climate such as ice cores, tree rings, glacier size, pollen counts, and ocean sediments. Scientists have also studied changes in Earth’s orbit around the sun and the activity of the sun itself.
The historical record shows that the climate varies naturally over a wide range of time scales. In general, climate changes prior to the Industrial Revolution in the 1700s can be explained by natural causes, such as changes in solar energy, volcanic eruptions, and natural changes in greenhouse gas (GHG) concentrations. Recent changes in climate, however, cannot be explained by natural causes alone. Research indicates that natural causes are very unlikely to explain most observed warming, especially warming since the mid-20th century. Rather, human activities can very likely explain most of that warming.
The greenhouse effect causes the atmosphere to retain heat
When sunlight reaches Earth’s surface, it can either be reflected back into space or absorbed by Earth. Once absorbed, the planet releases some of the energy back into the atmosphere as heat (in the form of infrared radiation). Greenhouse gases (GHGs) like water vapor (H2O), carbon dioxide (CO2), and methane (CH4) absorb infrared radiation, slowing or preventing the loss of heat to space. In this way, GHGs act like a blanket, making Earth warmer than it would otherwise be.
The Main Greenhouse Gasses
The most important GHGs directly emitted by humans include CO2, methane, nitrous oxide (N2O), and several others. The sources and recent trends of these gases are detailed below.
Carbon dioxide (CO2) is the primary greenhouse gas that is contributing to recent climate change. CO2 is absorbed and emitted naturally as part of the carbon cycle, through respiration, volcanic eruptions, and ocean-atmosphere exchange. Human activities, such as the burning of fossil fuels and changes in land use, release large amounts of carbon to the atmosphere, causing CO2 concentrations in the atmosphere to rise.
Atmospheric CO2 concentrations have increased by almost 40% since pre-industrial times, from approximately 280 parts per million (ppm) in the 18th century to 406 ppm in 2017. The current CO2 level is higher than it has been in at least 800,000 years.Some volcanic eruptions released large quantities of CO2 in the distant past. However, the U.S. Geological Survey (USGS) reports that human activities now emit more than 135 times as much CO2 as volcanoes each year. Human activities currently release over 30 billion tons of CO2 into the atmosphere every year.This build-up in the atmosphere is like a tub filling with water, where more water flows from the faucet than the drain can take away.
Methane (CH4) is produced through both natural and human activities. For example, wetlands, agricultural activities, and fossil fuel extraction and transport all emit CH4. Methane is more abundant in Earth’s atmosphere now than at any time in at least the past 650,000 years.Due to human activities, CH4 concentrations increased sharply during most of the 20th century and are now more than two and-a-half times pre-industrial levels. In recent decades, the rate of increase has slowed considerably.
Other Greenhouse Gasses
Water vapor is the most abundant greenhouse gas and also the most important in terms of its contribution to the natural greenhouse effect, despite having a short atmospheric lifetime. Some human activities can influence local water vapor levels. However, on a global scale, the concentration of water vapor is controlled by temperature, which influences overall rates of evaporation and precipitation.Therefore, the global concentration of water vapor is not substantially affected by direct human emissions.
Ground-level ozone (O3), which also has a short atmospheric lifetime, is a potent greenhouse gas. Chemical reactions create ozone from emissions of nitrogen oxides and volatile organic compounds from automobiles, power plants, and other industrial and commercial sources in the presence of sunlight (as discussed in section 10.1). In addition to trapping heat, ozone is a pollutant that can cause respiratory health problems and damage crops and ecosystems.
Changes in the sun’s energy affect how much energy reaches Earth’s system
Climate is influenced by natural changes that affect how much solar energy reaches Earth. These changes include changes within the sun and changes in Earth’s orbit. Changes occurring in the sun itself can affect the intensity of the sunlight that reaches Earth’s surface. The intensity of the sunlight can cause either warming (during periods of stronger solar intensity) or cooling (during periods of weaker solar intensity). The sun follows a natural 11-year cycle of small ups and downs in intensity, but the effect on Earth’s climate is small.Changes in the shape of Earth’s orbit as well as the tilt and position of Earth’s axis can also affect the amount of sunlight reaching Earth’s surface.
Changes in the sun’s intensity have influenced Earth’s climate in the past. For example, the so-called “Little Ice Age” between the 17th and 19th centuries may have been partially caused by a low solar activity phase from 1645 to 1715, which coincided with cooler temperatures. The “Little Ice Age” refers to a slight cooling of North America, Europe, and probably other areas around the globe. Changes in Earth’s orbit have had a big impact on climate over tens of thousands of years. These changes appear to be the primary cause of past cycles of ice ages, in which Earth has experienced long periods of cold temperatures (ice ages), as well as shorter interglacial periods (periods between ice ages) of relatively warmer temperatures.
Changes in solar energy continue to affect climate. However, solar activity has been relatively constant, aside from the 11-year cycle, since the mid-20th century and therefore does not explain the recent warming of Earth. Similarly, changes in the shape of Earth’s orbit as well as the tilt and position of Earth’s axis affect temperature on relatively long timescales (tens of thousands of years), and therefore cannot explain the recent warming.[12]