
2 Considerations in Designing Your Research Approach
Once you’ve identified your area of interest, sorted through and analyzed the literature to identify the problem you’d like to address, and developed both a purpose and a question; the next step is to design your study. This chapter will provide a basic overview of the considerations any researcher must think about as they design a research study.
Chapter 2: Learning Objectives
As you work to identify the best approach to identify an answer to your research question, you will be able to:
- Compare the conceptualization and operational activities of the process
- Discuss the difference between an independent and dependent variable
- Discuss the importance of sampling
- Contrast research approaches
- Demonstrate a systematic approach to selecting a research design
Understanding the Language of Research
As you work to determine which approach you will consider in order to best answer your question, you’ll need to consider how to address both the conceptual and operational components of your inquiry. As we discussed in Chapter 1; theory often informs practice (deductive approaches). Theory is often discussed in terms of abstract, or immeasurable, constructs. Because of the ambiguous nature of theory, it is important to conceptualize the parameters of your investigation. Conceptualizing is the process of defining what is or is not included in your description of a specific construct.
Understanding Theoretical and Contextual Framework
You may consider the theoretical or contextual framework for your study as the ‘lens’ through which you want your reader to view the work from. That is, this is your opportunity frame their experience with this information through your educated perspective on the material.
How Will You Determine the Subjective Aspects of Your Work?
Consider exploring one’s motivation to advance their education:
- Is motivation is the same as effort?
- That is if you’re determining whether clinicians who have advanced credentials are more motivated at work; you’ll need to create a clear delineation between motivation and effort and work out how to measure each of these independently
Operationalization is the process of defining concepts or constructs in a measurable way. As you dive into the ‘HOW’ you will go about your research, you will need to understand the terminology related to study design
Variables
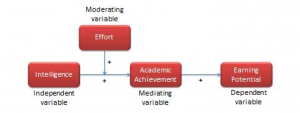
As we discussed in Chapter 1, there are several kinds of Variables. As a reminder, a variable is an objective and measurable representation of a theoretical construct. An independent variable is a variable which causes an effect on the dependent, or outcome variable. Note that there may be more than one independent variable in your study. Therefore, the dependent variable is the variable which you are measuring as an effect of an intervention or influence; you can think of this as the outcome variable. Identifying at least these two variables is an essential first step in designing your study. This is because how you explore the relationship between your effect (independent variable) and outcome (dependent variable) with help guide your methodology. Other variables to consider include mediating variables, which are variables that are explained by both the independent and dependent variables. Moderating variables influence the relationship between the independent and dependent variables and control variables which may have an impact on the dependent variable but does not help to explain the dependent variable.
Assigning Dependent and Independent Variables
You would like to determine the relationship between weight and tidal volume:
- Dependent Variable: Which variable DEPENDS on the other? Or, which variable will define the OUTCOME? (Tidal volume)
- Independent Variable: Does the variable INFLUENCE, HELP EXPLAIN, or have an IMPACT on the dependent variable? (Weight)
Assigning Dependent and Independent Variables
You would like to determine whether the number of hours spent in clinical training influences post training test scores:
- Dependent Variable: Score on post training test
- Independent Variable: Number of hours in clinical training
Identifying and assigning the dependent and independent variable(s) is one of the most important research activities as this will help guide you toward the type of information you’ll be collecting and what you will do with that information. However, as you consider both the outcome (dependent) variable and the impact (independent) variable, it is also important to consider what other variables may influence the relationship between these two primary variables.
There are very few instances wherein you can control EVERY variable. However, it is your job as a researcher to plan for, acknowledge, and attempt to address anything that may influence the results you present.
levels of measurement can be thought of as values within each variable. For example, traditionally, the variable ‘Gender’ had two values: male or female. The modern variable of ‘Gender’ may have several values which are used to delineate each potential designation within the variable. Each value represents a specific designation of measure.
Values of measures may be considered quantitative (numeric); in our example of traditional gender you may assign a numeric (quantitative) value to male and female as either ‘1’ and ‘2’, respectively. Values may also be assigned non-numerically; meaning they are qualitative. It is important to note that if you want to analyze non-numeric data, it must be coded first.
Understanding and Assigning Value
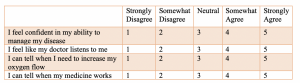
You may create a question asking respondents to rank their agreement with a statement on a scale ranging from strongly disagree to strongly agree. Although qualitative in nature, we can assign a numeric value to each level of measurement as a ‘code’.
- 1= Strongly Disagree
- 2= Somewhat Disagree
- 3= Neither Disagree nor Agree
- 4= Somewhat Agree
- 5= Strongly Agree
By doing this, we can explore relationships between the attributes and variables using quantitative statistical methods.
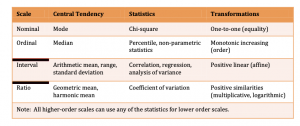
Levels of measurement
One of the most important aspects of operationalizing a theoretical construct is to determine the level(s) of measurement. This is done by assessing the types of variables and values:
- Nominal: also called categorical. This level of measurement is used to describe a variable with two or more values BUT there is no intrinsic ordering to the categories
Example of a Nominal Variable
You would like to collect information about the gender (variable) of individuals participating in your study. Your level of measures may be:
- Male
- Female
- Non-Binary
You may then assign these measures a numeric value:
- Male =1
- Female=2
- Non-Binary=3
- Ordinal: This level of measurement is used to describe variable values that have a specific rank order. BUT that order does not indicate a specificity between ranks.
Example of an Ordinal Variable
You provide a scale of agreement for respondents to indicate their level of agreement with the use of a current policy within the hospital:
- Strongly Agree
- Agree
- Disagree
- Strongly Disagree
Note: Those who strongly disagree with the use of this policy disapprove MORE than do those who disagree; however, there is no quantifiable value for how much more.
- Interval: You’ll use this level of measurement for variable values which are rank ordered AND have specified intervals between ranks and can tell you ‘how much more’.
Example of an Interval Variable
You classify the ages of the participants in your study:
- 18-24 years old
- 25-30 years old
- 31-35 years old
- >35 years old
NOTE: 35 is 5 more than 30. The quantifiable ‘how much more’ is what distinguishes age as an interval variable.
- Ratio: Ratio values have all of the qualities of a nominal, ordinal, and/or interval scale BUT ALSO have a ‘true zero’. In this case true zero indicates a lack of the underlying construct (i.e. it does not exist). Additionally, there is a ratio between points on this particular scale. That is, in this case, 10 IS twice that of 5.
Example of a Ratio Variable
You are doing a pre and post bronchodilator treatment trial for a new drug. You must establish baseline heart rate in your treatment group:
- Pulse rate is a ratio variable because the scale has an absolute zero (asystole) and there is a ratio between the number of times the heart beats (i.e. a change in heart rate of 10 beats per minute)
Identification of variable and values is essential to a successful project. Not only will doing this early in the process allow you to predict factors that may affect your research question, but it will also guide you toward the type of data you will collect and determine what kind of statistical analyses you will likely be performing in order to understand and present the results of your work.
Scales
Scales are used to glean insight into a situation or phenomenon and can be used to help quantify information that would otherwise be difficult to understand or convey. Although there are several types of scales used by researchers, we’ll focus on the two of the most common:
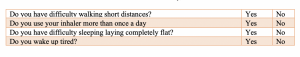
- Binary scale: Nominal scale that offers two possible outcomes, or values. Questions that force a respondent to answer either ‘yes’ or ‘no’ utilize a binary scale. IF you offer more than two options, your scale is no longer binary, but is still a nominal scaled item
- Likert scales: Likert scales are popular for measuring ordinal data and include indications from respondents. Data can be quantified using codes assigned to responses and an overall summation for each attribute can be associated with each respondent
Sampling
Sampling is the statistical process of selecting a subset (called a “sample”) of a population of interest for purposes of making observations and statistical inferences about that population. We cannot study entire populations because of feasibility and cost constraints, and hence, we must select a representative sample from the population of interest for observation and analysis. It is extremely important to choose a sample that is truly representative of the population so that the inferences derived from the sample can be generalized back to the population of interest. Probability sampling is a technique in which every unit in the population has a chance (non-zero probability) of being selected in the sample, and this chance can be accurately determined. An example of probability sampling is simple random sampling wherein you include ALL possible participants in a population and utilize a method to randomly select a sample that is representative of that population. Nonprobability Sampling is a sampling technique in which some units of the population have zero chance of selection or where the probability of selection cannot be accurately determined. Typically, units are selected based on certain non-random criteria, such as quota or convenience. Because selection is non-random, nonprobability sampling does not allow the estimation of sampling errors, and may be subjected to a sampling bias. Therefore, information from a sample cannot be generalized back to the population. An example of nonprobability sampling is utilizing a convenience sample of participants due to your close proximity or access to them.
Why does sampling matter?
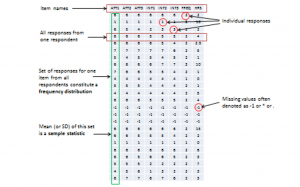
When you measure a certain observation from a given unit, such as a person’s response to a Likert-scaled item, that observation is called a response. In other words, a response is a measurement value provided by a sampled unit. Each respondent will give you different responses to different items in an instrument. Responses from different respondents to the same item or observation can be graphed into a frequency distribution based on their frequency of occurrences. For a large number of responses in a sample, this frequency distribution tends to resemble a bell-shaped curve called a normal distribution, which can be used to estimate overall characteristics of the entire sample, such as sample mean (average of all observations in a sample) or standard deviation (variability or spread of observations in a sample). These sample estimates are called sample statistics (a “statistic” is a value that is estimated from observed data). Populations also have means and standard deviations that could be obtained if we could sample the entire population. However, since the entire population can never be sampled, population characteristics are always unknown, and are called population parameters (and not “statistic” because they are not statistically estimated from data). Sample statistics may differ from population parameters if the sample is not perfectly representative of the population; the difference between the two is called sampling error. Theoretically, if we could gradually increase the sample size so that the sample approaches closer and closer to the population, then sampling error will decrease and a sample statistic will increasingly approximate the corresponding population parameter.
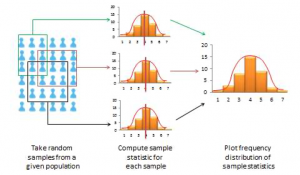
If a sample is truly representative of the population, then the estimated sample statistics should be identical to corresponding theoretical population parameters. How do we know if the sample statistics are at least reasonably close to the population parameters? Here, we need to understand the concept of a sampling distribution. Imagine that you took three different random samples from a given population, as shown below, and for each sample, you derived sample statistics such as sample mean and standard deviation. If each random sample was truly representative of the population, then your three sample means from the three random samples will be identical (and equal to the population parameter), and the variability in sample means will be zero. But this is extremely unlikely, given that each random sample will likely constitute a different subset of the population, and hence, their means may be slightly different from each other. However, you can take these three sample means and plot a frequency histogram of sample means. If the number of such samples increases from three to 10 to 100, the frequency histogram becomes a sampling distribution. Hence, a sampling distribution is a frequency distribution of a sample statistic (like sample mean) from a set of samples, while the commonly referenced frequency distribution is the distribution of a response (observation) from a single sample. Just like a frequency distribution, the sampling distribution will also tend to have more sample statistics clustered around the mean (which presumably is an estimate of a population parameter), with fewer values scattered around the mean. With an infinitely large number of samples, this distribution will approach a normal distribution. The variability or spread of a sample statistic in a sampling distribution (i.e., the standard deviation of a sampling statistic) is called its standard error. In contrast, the term standard deviation is reserved for variability of an observed response from a single sample.
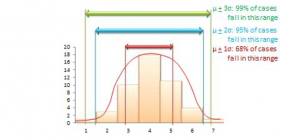
The mean value of a sample statistic in a sampling distribution is presumed to be an estimate of the unknown population parameter. Based on the spread of this sampling distribution (i.e., based on standard error), it is also possible to estimate confidence intervals for that prediction population parameter. Confidence interval is the estimated probability that a population parameter lies within a specific interval of sample statistic values. All normal distributions tend to follow a 68-95-99 percent rule (see below), which says that over 68% of the cases in the distribution lie within one standard deviation of the mean value (μ 1σ), over 95% of the cases in the distribution lie within two standard deviations of the mean (μ 2σ), and over 99% of the cases in the distribution lie within three standard deviations of the mean value (μ 3σ). Since a sampling distribution with an infinite number of samples will approach a normal distribution, the same 68-95-99 rule applies, and it can be said that:
- (Sample statistic one standard error) represents a 68% confidence interval for the population parameter.
- (Sample statistic two standard errors) represents a 95% confidence interval for the population parameter.
- (Sample statistic three standard errors) represents a 99% confidence interval for the population parameter.
A sample is “biased” (i.e., not representative of the population) if its sampling distribution cannot be estimated or if the sampling distribution violates the 68-95-99 percent rule. As an aside, note that in most regression analysis where we examine the significance of regression coefficients with p<0.05, we are attempting to see if the sampling statistic (regression coefficient) predicts the corresponding population parameter (true effect size) with a 95% confidence interval. Interestingly, the “six sigma” standard attempts to identify manufacturing defects outside the 99% confidence interval or six standard deviations (standard deviation is represented using the Greek letter sigma), representing significance testing at p<0.01.
Types of Research Designs
There are many different approaches to research. The list provided here is not exhaustive by any means; rather, this is a brief list of the most common approaches you may identify as you review the literature related to your interest.
Experimental
Experimental research is typically performed in a controlled environment so that the researcher can manipulate an independent variable and measure the outcome (dependent variable) between a group of subjects who received the manipulated variable (intervention) and a group of subjects who did not receive the intervention. This type of design typically adheres to the scientific method in order to test a hypothesis. A hypothesis is a proposed explanation for a phenomenon and serves as the starting point for the investigation. You may see a hypothesis indicated as (HO), also called the null hypothesis. This is to differentiate it from an alternative hypothesis (H1 or HA), which is any hypothesis other than the null.
Development of the Hypothesis
There are two types of hypotheses, the null (HO) and an alternative (H1 or HA)
- HO= There is no significant difference between length of stay for patients diagnosed with COPD and those diagnosed with CHF.
- H1 or HA= There is a significant difference between length of stay for patients diagnosed with COPD and those diagnosed with CHF
NOTE: Accepting the null hypothesis would mean that your data confirm that there is no difference. Rejecting the null would mean that your data indicated that there is a significant difference in patient outcomes for these groups; therefore, rejecting the null means accepting an alternative hypothesis.
Randomized Experimental: Participants are randomly assigned to either a treatment (intervention) or a control group. Typically, the treatment group receives an intervention (independent variable) and the outcome of each group is considered dependent variables and compared for effect. Independent variables in this case are considered active in that this variable can be manipulated.
Example of Randomized Experimental Approach
You would like to assess outcomes as they relate to the post delivery resuscitation of very low birthweight infants in the delivery room. You have decided that one group will receive direct intubation and surfactant (intervention group) in the delivery room and the other will receive the standard care of CPAP (control group). Participants will be randomly assigned to groups and as a bonus, the assignment to groups will be blinded. You will then compare the difference between participants in each group regarding need for oxygen at 36 weeks adjusted gestational age.
- Dependent Variable: Need for oxygen at 36 weeks adjusted gestational age
- Independent Variable (Active): Administration of surfactant
Quasi Experimental: Similar to the randomized experimental approach aside from the random assignment. In quasi-experimental approaches, participants are NOT randomly assigned; however, one group does receive an intervention while the control group does not and outcomes are still compared. The independent variable is also active.
Example of Quasi Experimental Approach
You would like to assess outcomes as they relate to the post delivery resuscitation of very low birthweight infants in the delivery room. You have decided that one group will receive direct intubation and surfactant (intervention group) in the delivery room and the other will receive the standard care of CPAP (control group). Participants will be assigned to groups based on administration of maternal steroids. You will then compare the difference between participants in each group regarding need for oxygen at 36 weeks adjusted gestational age.
- Dependent Variable: Need for oxygen at 36 weeks adjusted gestational age
- Independent Variable (Active): Administration of surfactant
Non Experimental
Non-experimental approaches include a wide variety of approaches; therefore, it is difficult to list them all in a succinct way here. However, it is safe to say that a study approach is considered non-experimental when there lacks intentional manipulation of the independent variable.
Comparative approach: Groups are compared to reveal differences in outcome (dependent variable). Groups are typically formed based on independent variables that cannot be manipulated but are important to the study. This type of independent variable is known as an attribute independent variable. In this approach there are a few categories (2-4 levels) of attribute independent variables that are then compared.
Example of Comparative Approach
You would like to investigate the perceptions of first and second year student-instructor engagement and student learning and instructor motivation in the clinical environment.
- Dependent Variable: Student perception of experience (2 levels: First and second year)
- Independent Variable: Student-instructor engagement in learning and motivation
Associational or Correlational approach: Two or more variables for the same group of participants are explored for relationships. Independent variables are also attributive in this approach; meaning, they can be manipulated to impact the dependent variable. Variables included in this approach are typically continuous or have at least five ordered categories.
Example of Associational or Correlational Approach
You would like to conduct a study to better understand practitioner attitudes about the future of the profession.
- Dependent Variable: Attitude about the future of the profession
- Independent Variable(s): Age, gender, autonomy
Descriptive research: Projects which only gather data which can be described, not inferred. That is, results and data collected cannot be inferred back to the population nor can comparisons or associations be made. Many qualitative studies are considered descriptive. This is done by considering only one variable at a time and there is no independent variable.
Example of Descriptive Research
You would like to describe the development of a protocol to implement high flow nasal cannula as an intermediate therapy for acute respiratory failure to be used in the Emergency Department at your institution. You plan to compare rates of intubation before and after implementation of the protocol.
- You are DESCRIBING a process
- You may collect and compare data using descriptive statistics
It is important to note that it is possible to have more than one approach in one research project. This is because the approach selected is specific to the question that has been asked. If there is more than one question asked, it is reasonable to assume that more than one approach may be used.
There are a few areas of research that although fit under the category of non-experimental; do not quite fit within the classifications presented here. Two of these areas are quality improvement (QI) projects and protocol development.
Quality improvement (QI) projects: The purpose of a QI project is to evaluate the performance of systems, processes, or practices to determine whether either function or operational improvements are needed. Using tools such as the SQUIRE explanation and elaboration guidelines, is extremely helpful in developing, conducting, and analyzing a thorough and impactful QI project.
The SQUIRE guidelines focus on the following four questions:
- Why did you start?
- What did you do?
- What did you find?
- What does it mean?
These four questions are then expanded upon to help develop the systematic approach to your inquiry and presentation of your findings. An extended investigation of this method is covered in Chapter 6.
Protocol Development
Before we dig too deep into the development of protocols, a clarification needs to be made regarding vocabulary relating to projects of this nature. Although frequently used interchangeably, the terms protocol and guideline are not synonymous. A protocol is described as an official procedure or system of rules governing a process. A guideline is a suggested course of action, policy, or conduct. In healthcare, this is an important distinction; a protocol is a course of action to which treatment must follow without deviation whereas a guideline, although firmly rooted in evidence, allows for deviation based on best judgment of a clinician or presentation of a specific case. Through a research lens, this distinction is important because the process by which these two objectives are realized are very different. The complete process for the development of guidelines which are generalizable beyond a specific situation is best outlined by the World Health Organization Handbook
The development of both guidelines often involves a team of people who are charged with first evaluating the existing evidence and then contributing an interpretation of that evidence toward the consensus of best practice. This is why guidelines are typically issued by federal or state agencies or professional organization. Protocols are generally less generalizable due to contextual constraints. However, even organizational protocols are not developed by a single individual. This does not mean, however, that you cannot begin the process of developing a guideline or protocol for your organization on you own; rather, it is important to frame the work you contribute as the foundation upon which a group can work toward the consensus of best practice. Typically, this initial work is referred to as a narrative review. A narrative review can be described as a broad perspective on a topic which may or may not be impacted by bias. This type of review differs from a systematic review in that it is understood that a narrative review may not encompass all relevant literature on a relevant topic as might a systematic review. Another note; the development of both guidelines and protocols is often an iterative process requiring several cycles of evaluation and revision. A systematic review is described as exhaustive review of the literature relevant to a specific topic. In addition to being exhaustive, a systematic review includes methodology which is both explicit and reproducible to select, evaluate, and synthesize ALL available evidence. A meta-analysis is a systematic approach to evaluating the data from independent studies of the same subject to evaluate overall trends. Often, a meta-analysis is part of a systematic review.
Selecting your approach
As we’ve discussed, there are several factors which will guide your approach selection. Emphasis should be placed on the development of your purpose and problem statements as well as your research question. Ambiguity in these areas may cause some confusion as you begin to consider what approach you will take to answer your question. Here we will work to narrow the scope of your approach using a systematic process and answering a few specific questions:
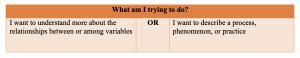
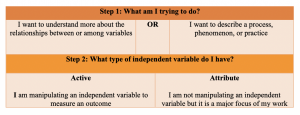
Step 1: Outlining your general purpose
Understanding the overarching goal of your study will help direct the rest of your approach. Here, you will ask yourself “What am I trying to do?”.
Step 2: Identifying your general approach
Earlier we discussed the difference between experimental and non-experimental approaches. As we mentioned, these are two broad categories of approaches. Your general purpose will determine which of these two general approaches you take. The determination here will point you toward a more focused, or specific, approach.
- Experimental: Experimental research is typically performed in a controlled environment so that the researcher can manipulate an independent variable and measure the outcome (dependent variable) between a group of subjects who received the manipulated variable (intervention) and a group of subjects who did not receive the intervention. A true experimental approach means that you have random selection or assignment of participants. All other elements aside, if you do NOT have randomization incorporated into your approach, your approach becomes quasi-experimental.
- Non-experimental: Nonexperimental research is an extremely broad category of approaches. Therefore, the simplest way to explain non-experimental research is to simply state that this approach lacks the manipulation of an independent variable. That is, you are not imposing an intervention on one group and comparing the outcome with a control group. Rather, you may have attribute independent variables which influence, or impact, the dependent variable, but the purpose of the research is not the direct manipulation of that variable. There are several different types of non-experimental research approaches, as we will soon see; however, it is important to understand that descriptive research is always classified as nonexperimental.
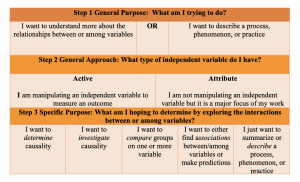
Step 3: Narrowing down your specific purpose
Now that you’ve decided what the general purpose and approach, you can begin to really narrow down the ‘how’ of your research. I find that this is best done by again asking yourself what you are really trying to do. Now that you understand the boundaries of your purpose and approach, you can work to understand the fine points about what types of interactions between variables you’re looking to explore and determine.
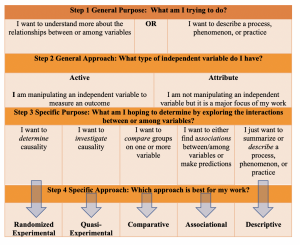
Step 4: Selecting your specific approach
As you can see, there are specific words you should pay attention to when you’re describing your purpose. Given these key words, like ‘determine causality’, or ‘compare groups’, you’ll have a bit more direction as to what approach is most appropriate to identify the best answer to your question. Once we know what it is we really want to do with the information we’re planning to gather (variables), we can select an approach.
Selecting your specific approach
Key Takeaways
There are several important concepts presented in this chapter:
- The theoretical/conceptual framework is the frame, or lens, that YOU build for your reader. It is the perspective through which you would like them to view your work.
- Constructs represent abstract theory
- Variables are the concrete measures of constructs
- There are several different types of variables; however, understanding the relationship between the independent variable (impact variable) and the dependent variable (outcome variable) is extremely important
- Attributes are levels within variables
- Attributes and variables must be classified in terms of measurement: Nominal, ordinal, interval, and ratio variables each represent different information and must be assessed correctly to have meaning
- Sampling is very important because whether your sample represents the larger population is an important factor in how your research is presented and interpreted
- There are A LOT of different approaches to research. Systematically approaching the selection of your approach by first defining your problem and purpose statements and your research question will be helpful as you narrow your focus on the which approach best captures the interaction between or among variables
Resources
Crawford, L.M., Burkholder, G.J., Cox, K.A. (2020). Writing the Research Proposal. In G.J. Burkholder, K.A Cox, L.M. Crawford, and J.H. Hitchcock (Eds.), Research design and methods: An applied guide for the scholar-practitioner (pp. 309-334). Sage Publications
Gliner, J.A., Morgan, G.A., & Leech, N.L. (2017). Research methods in applied settings: An integrated approach to design and analysis. Routledge
- This section can be attributed to Bhattacherjee, A. (2012) published under Creative Commons Attribution-NonCommercial-ShareAlike 3.0 Unported License ↵
Defining a construct through your lens as a researcher. How you are choosing to describe the boundaries associated with your work
A measurable representation of an abstract construct
A variable that can explain another variable. A variable which may be manipulated (active) or describes (attribute) to affect an outcome
The variable which is measured as an outcome and is affected by the independent variable(s)
Variables that are explained by both the independent and dependent variables
Influence the relationship between the independent and dependent variable
A variable which has an impact on the dependent variable, but does not explain the outcome (dependent variable)
values within each variable.
The assignment of a number to an attribute to describe a variable
Variable with two or more layers but without a specific order
A variable which has a specific rank order but no specificity between the ranks
Rank ordered variable with specified intervals between ranks
Has a true zero within the scale against which it is measured
A tool, or measure, used to quantify material that may be difficult to do so otherwise
Nominal scale with two potential outcomes
Used to measure ordinal data with a ranking system
Method of selecting a subset of the population to study.
Method of sampling wherein potential for sampling is equally likely for the entire population
Method of sampling where in the likelihood of being selected into a sample is not equal across the population
Visual representation of how a sample falls around a mean
A proposed explanation for the observed phenomenon
A form of experimental study design were participants are randomly assigned to either an intervention or control group
A form of experimental design involving both intervention and control groups but lacks randomization
Groups of participants are compared to identify differences in outcome
Two or more variables for the SAME group of participants are explored for relationships
Research projects wherein data gathered and described, but no relationships are inferred
A subset of nonexperimental research wherein the performance of systems, processes, or practices are evaluated for either efficiency or effectiveness
An official procedure or system
A suggested course of action
A broad perspective on a topic, typically from the perspective of a single author
An exhaustive review of literature relevant to a specific topic; typically performed by a group of people
Systematic approach to evaluating data from independent studies on a topic to evaluate or identify trends
Research performed in a controlled environment in which a researcher can manipulate an independent variable and measure a dependent variable (outcome)
Broad category of research approaches which lack the manipulation of an independent variable