
1 Shifting your Mindset: Thinking Like a Researcher
There is a stark difference between being a ‘consumer’ of research and an ‘author’ of research. That is, although a reader may look at a research article and glean insight for application to their own practice, the reader relies upon the integrity of both the author, or authors, as well as in the rigor of the journal such that the information presented is accurate enough to be made public and hopefully, adapted. The critical reader will begin to understand that the ‘process’ of research informs the practice of ‘doing’. The novice researcher will begin to apply those processes to investigation of focused inquiry.
So, as you’ve made it this far, it’s likely safe to say that you’re interested in evolving past a simple consumer of research and are interested in understanding the process further, maybe even design and implement your own research? First thing is first: You’ll need to shift your perspective from, ‘I want answers’ to ‘I have a question’.
Chapter 1: Learning Objectives
As you work to shift your perspective from research consumer to research contributor, you’ll be able to do the following things:
- Identify the steps of the research process
- Describe the difference between a statement of purpose and a problem statement
- Discuss how to articulate a research question
- Describe the basic considerations for selecting a research approach
Understanding the Research Process
What goes into pursuing inquiry? This will depend on YOU and the orientation of your interest. That is, there are several factors which will influence your ability to conduct an investigation. Below is a list of broad steps and goals to consider as you begin to ‘think like a researcher’:
- Determine an area of interest
Chances are that you’re drawn to a specific subject area because of something that you’re currently doing or because of something that has impacted you personally. It may even be a topic that you’re genuinely interested in exploring further. Regardless of the subject matter, it is imperative that you take a systematic approach to your investigation so as not to get lost in the sheer volume of information available to you.
- Identify your orientation of interest
We’ve established that your interest in a subject is rooted to a connection which drives your interest. Next, you’ll need to consider your perspective on the information and discern how your perspective may influence your approach to the research. That is, our biases, either implicit or explicit, have a definite impact on how we approach and utilize the evidence.
- Start digging!
Although a strong and clear interest is important, you do not want to waste time doing work which has already been done. Your goal as an emerging researcher is to ADD to, or build upon, the evidentiary basis of a topic of interest. The best way to narrow the scope of your interest is to thoroughly review the existing literature on your topic of interest to see what has already been discovered and to identify the spot in which your interests align with a gap in the knowledge about the topic.
- Gather information
As you sift through the literature available which pertains to your topic of interest, you will want to have several goals in mind. First, you will want to get a sense for what has already been discovered or is general knowledge about the topic. This foundational reading will serve as the framework for your general understanding about the topic. As you build both a breadth and depth of understanding, you’ll likely begin to notice patterns in the literature.
Goal: Determine a problem. What still needs to be answered in the area you’re interested in? What can you do to address this gap?
As you read through the literature, you’ll likely start to have more questions than answers. This is normal! However, keep in mind your scope of interest. For example, if you are interested in the rates of depression among post-partum mothers of very premature infants, spending time reading about the rates of depression in traveling salesmen isn’t going to be overly helpful and may actually distract you from finding the information you’re looking for. If you’re having a hard time finding information about what you’re looking for… You’ve already found the problem! That is, perhaps there hasn’t been enough work done to establish an understanding about post-partum depression in this particular subgroup of individuals.
The information you gather will help you develop a problem statement, a purpose statement, and articulate a research question.
A problem statement is a literature-based concern that is applicable to a wide audience (e.g. a profession). A problem statement is NOT a situation which comes from personal experience. Problem statements should include:
-
-
-
- The problem itself
- Who will use the information and why it is important?
- How your study will address the problem?
-
-
How Should a Problem Statement Be Articulated?
Developing a purpose statement can be a difficult concept. In a nutshell, the purpose statement is your opportunity to tell the audience how your work will address the problem. Typically, the purpose statement follows the problem statement and should include:
-
-
-
- Study design (HOW): In very few words, the reader should get a sense of how you are performing this work.
- Intent (WHY): The reader should clearly understand why this work is being done.
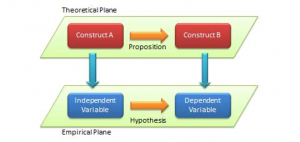
- Variables or Phenomenon (WHAT): The reader should understand what, specifically, is being studied in relation to why. Here is where you have to separate constructs from variables. Constructs are ideas or concepts which are not always (but may be) directly measurable. Rather than measuring ‘constructs’, we search for proxies; or ways to represent a construct. One way we can do this is by identifying variables which measure the construct. A variable is a measurable representation of a construct. An important concept here is that a variable must vary. That is, there must be at least two levels measured for any one variable. An Independent Variable a variable that may explain another variable (AKA: Impact Variables). When you consider the ‘independence’ of a variable, you must consider how much control can be exerted over the variable. A Dependent Variable is a variable that is explained BY other variables (AKA: Outcome Variables). Other Variables: Mediating variables are variables that are explained by both independent and dependent variables. Moderating variables are variables which influence the relationship between the independent and dependent variables. Control variables are variables which may have an impact on the dependent variable but does not help to explain the dependent variable.
- Participants (WHO): The reader should have a grasp on who this work will pertain to. That is, a population describes the entirety of the group you want to draw conclusions about whereas a sample is the specific group that you will actually draw conclusions about. Therefore, a sample will always be smaller than the population and the goal is that the findings relating to your sample are generalizable to the population.
- Context (Describe boundaries): Because you will have boundaries which limit your work, you should express them clearly here. These boundaries will influence how you approach, organize, pursue, and present the information. Common boundaries to entry-level research include:
- The environment in which the investigation will take place
- The access you have to the sample you wish to investigate
- The type of data you will collect
- The institutional-specific requirements of the research process
-
-
Developing a Quantitative Purpose Statement (Creswell & Creswel, 2018, p. 119 as cited in Gliner et al. 2017)
The purpose of this _____ (design) study is to ______(test or describe) the theory of ________, which _________(describes, compares, or relates) the ______________(independent variable) with ____________(Dependent variable), Controlling for ___________(name the control variables if appropriate) for________________(Participants) at _________________(Site). The independent variables are generally defined as ____________(general definition). The dependent variables are generally defined as _____________(General definition). The control and intervening variables, ______________(identify if appropriate), will be statistically controlled in the study.
Developing a Qualitative Purpose Statement (Creswell & Creswel, 2018, p. 124 as cited in Gliner et al. 2017)
Now, it may seem as though you’ve spelled things out for your reader; however, you’ve still not actually stated the question you have; your research question. The type of question will help identify what information should be articulated in the question as well as help describe what approach you will take to answer the question.
A well-defined research question should:
-
-
-
-
- Frame the focus of the study: Stating explicitly the ‘what’, ‘who’, ‘why’, ‘how’, and perhaps even ‘where’ the attention of the work will be focused.
- Set the boundaries of the study to establish scope: Using definitive words will help your reader understand how they will be able to generalize your work to their specific interests.
- Point you toward data needed to answer the question: Although not usually explicitly stated within the question, how you phrase your question should allude to the approach that you are taking and therefore, infer the type of data which will be discussed.
-
-
-
Quantitative Research Questions
Quantitative approaches are those which make comparisons or examine relationships between or among variables. These types of questions include words like ’cause’, ‘relate’, ‘relationship’, or ‘association’
- Is there a relationship between depression scores on the XYZ scale and mothers who have premature infants born at 28 weeks gestation or fewer?
Quantitative approaches are deductive forms of inquiry where variables are measured using using objective statistical methods to either describe or generalize results.
Qualitative Research Questions
Qualitative approaches are those where the intention is to explore, discover, or describe an experience or phenomenon. These types of approaches include words like ‘how’ or ‘what’.
- What is the experience of mothers of infants born at 28 weeks gestation or fewer with depression-like symptoms?
Qualitative approaches are inductive forms of inquiry where variables are measured using more subjective measures that often generate non-numeric data and rely upon educated interpretation for analysis.
Overall, your main goal in developing a problem statement, a purpose statement, and a well described question is to first, define the scope of your work and how it fills the gap in understanding you found while digging through the existing research. In working to fill this gap and defining the scope of your work in the context of your gap, clearly delineating your problem, purpose, and question will help guide your approach.
5. Establish the context
We’ve discussed the need to understand the orientation of your inquiry from your perspective. Another important step is to determine whether there is a theoretical or contextual framework which will guide your work. A theory is a method of explaining some ‘thing’; a behavior, event, or phenomenon. That is, it’s a system of interrelated constructs which explain a phenomenon in a bounded system. Theories provide the logic of an observation by explaining what the key drivers and outcomes of a phenomenon are. Theories also help us make sense of an observation by incorporating empirical evidence and comparing outliers to that evidence and provide the foundation for future research by examining the gaps among the relationships and guiding insight about how to address those gaps. Theory works in parallel with empirical work to reconcile the concept with the evidence
6. Establish the ‘HOW’
Are you planning no observing and describing something objectively? Or, are you planning to be involved with the subjects? Also, something to consider: What is your main goal? That is, are you testing a theory (Positivist)? Or hoping to build a theory (Interpretive)? Are you seeking to test a hypothesis about causal relationships (Experimental)? Or simply describing characteristics or relationships between things (Non-Experimental)? Understanding your end goal will help you to design the best way to answer your research question.
Your approach will become your blueprint for the research process. Identifying ‘WHAT’ you are studying will help to guide the ‘HOW’ of your research. Here is a description of several methods which will help inform ‘HOW’ you pursue an answer to your research question:
-
-
-
- Positive methods: TEST theories using a deductive approach. These methods start with a theory in mind and test hypotheses to challenge that theory. Again, many of these approaches are classified as quantitative.
- Laboratory experiments
- Survey research
- Interpretive methods: BUILD theories using inductive approaches and uses observed data to create a theory. Many of these approaches are classified as qualitative.
- Action research
- Ethnography
- Positive methods: TEST theories using a deductive approach. These methods start with a theory in mind and test hypotheses to challenge that theory. Again, many of these approaches are classified as quantitative.
-
-
As you work to identify both your ‘what’ and your ‘how’, it is helpful to understand what types of studies are common throughout your field of inquiry. As you review the literature, take a look at the methods by which the authors have generated their results and take note. Can you utilize similar methods? Or, are you wanting to take a completely different approach? As Jhangiani et al, (n.d.) identify, there are three overarching approaches to research:
-
-
-
-
-
- Experimental: Researchers who want to test hypotheses about causal relationships between variables (i.e., their goal is to explain) need to use an experimental method. This is because the experimental method is the only method that allows us to determine causal relationships. Using the experimental approach, researchers first manipulate one or more variables while attempting to control extraneous variables, and then they measure how the manipulated variables affect participants’ responses.
- Quasi Experimental: This design is similar to the experimental design; however, participant assignment is not random.
- Non-Experimental: Researchers who are simply interested in describing characteristics of people, describing relationships between variables, and using those relationships to make predictions can use non-experimental research. Using the non-experimental approach, the researcher simply measures variables as they naturally occur, but they do not manipulate them. For instance, if I just measured the number of traffic fatalities in America last year that involved the use of a cell phone but I did not actually manipulate cell phone use then this would be categorized as non-experimental research. Alternatively, if I stood at a busy intersection and recorded drivers’ genders and whether or not they were using a cell phone when they passed through the intersection to see whether men or women are more likely to use a cell phone when driving, then this would be non- experimental research. It is important to point out that non-experimental does not mean nonscientific. Non-experimental research is scientific in nature. It can be used to fulfill two of the three goals of science (to describe and to predict). However, unlike with experimental research, we cannot make causal conclusions using this method; we cannot say that one variable causes another variable using this method.
-
-
-
-
Understanding your approach will help identify what kind of data you will be collecting and what you will do what that data. As you consider your approach you will need to consider how sound your research approach is. That is, you’ll need to consider how well your study is designed to glean insight that truly represents the behavior, process, or phenomenon that you’re investigating. This is where validity comes into play. Although the concept of validity is quite extensive, the two primary types of validity you should be concerned with here are internal and external validity.
-
-
-
-
- Internal Validity: Refers to the degree to which we can confidently infer a causal relationship between variables. When we conduct an experimental study in a laboratory environment we have very high internal validity because we manipulate one variable while controlling all other outside extraneous variables. When we manipulate an independent variable and observe an effect on a dependent variable and we control for everything else so that the only difference between our experimental groups or conditions is the one manipulated variable then we can be quite confident that it is the independent variable that is causing the change in the dependent variable. In contrast, because field studies are conducted in the real-world, the experimenter typically has less control over the environment and potential extraneous variables, and this decreases internal validity, making it less appropriate to arrive at causal conclusions.
- External Validity: Refers to the degree to which we can generalize the findings to other circumstances or settings, like the real- world environment. When internal validity is high, external validity tends to be low; and when internal validity is low, external validity tends to be high. So laboratory studies are typically low in external validity, while field studies are typically high in external validity. Since field studies are conducted in the real-world environment it is far more appropriate to generalize the findings to that real-world environment than when the research is conducted in the more artificial sterile laboratory.
-
-
-
7. Gather and analyze your data
Once your study is complete and the observations have been made and recorded, researchers need to analyze the data and draw conclusions. Typically, data are analyzed using both descriptive and inferential statistics. Descriptive statistics are used to summarize the data and inferential statistics are used to generalize the results from the sample to the population. In turn, inferential statistics are used to make conclusions about whether or not a theory has been supported, refuted, or requires modification.
Descriptive Statistics
Descriptive statistics are used to organize or summarize a set of data. Examples include percentages, measures of central tendency (mean, median, mode), measures of dispersion (range, standard deviation, variance), and correlation coefficients.
Measures of central tendency are used to describe the typical, average and center of a distribution of scores. The mode is the most frequently occurring score in a distribution. The median is the midpoint of a distribution of scores. The mean is the average of a distribution of scores.
Measures of dispersion are also considered descriptive statistics. They are used to describe the degree of spread in a set of scores. So are all of the scores similar and clustered around the mean or is there a lot of variability in the scores? The range is a measure of dispersion that measures the distance between the highest and lowest scores in a distribution. The standard deviation is a more sophisticated measure of dispersion that measures the average distance of scores from the mean. The variance is just the standard deviation squared. So it also measures the distance of scores from the mean but in a different unit of measure.
Typically means and standard deviations are computed for experimental research studies in which an independent variable was manipulated to produce two or more groups and a dependent variable was measured quantitatively. The means from each experimental group or condition are calculated separately and are compared to see if they differ.
For non-experimental research, simple percentages may be computed to describe the percentage of people who engaged in some behavior or held some belief. But more commonly non-experimental research involves computing the correlation between two variables. A correlation coefficient describes the strength and direction of the relationship between two variables. The values of a correlation coefficient can range from −1.00 (the strongest possible negative relationship) to +1.00 (the strongest possible positive relationship). A value of 0 means there is no relationship between the two variables. Positive correlation coefficients indicate that as the values of one variable increase, so do the values of the other variable. A good example of a positive correlation is the correlation between height and weight, because as height increases weight also tends to increase. Negative correlation coefficients indicate that as the value of one variable increase, the values of the other variable decrease. An example of a negative correlation is the correlation between stressful life events and happiness; because as stress increases, happiness is likely to decrease.
Inferential Statistics
As you learned in the section of this chapter on sampling, typically researchers sample from a population but ultimately they want to be able to generalize their results from the sample to a broader population. Researchers typically want to infer what the population is like based on the sample they studied. Inferential statistics are used for that purpose. Inferential statistics allow researchers to draw conclusions about a population based on data from a sample. Inferential statistics are crucial because the effects (i.e., the differences in the means or the correlation coefficient) that researchers find in a study may be due simply to random chance variability or they may be due to a real effect (i.e., they may reflect a real relationship between variables or a real effect of an independent variable on a dependent variable).
Researchers use inferential statistics to determine whether their effects are statistically significant. A statistically significant effect is one that is unlikely due to random chance and therefore likely represents a real effect in the population. More specifically results that have less than a 5% chance of being due to random error are typically considered statistically significant. When an effect is statistically significant it is appropriate to generalize the results from the sample to the population. In contrast, if inferential statistics reveal that there is more than a 5% chance that an effect could be due to chance error alone then the researcher must conclude that their result is not statistically significant.
It is important to keep in mind that statistics are probabilistic in nature. They allow researchers to determine whether the chances are low that their results are due to random error, but they don’t provide any absolute certainty. Hopefully, when we conclude that an effect is statistically significant it is a real effect that we would find if we tested the entire population. And hopefully when we conclude that an effect is not statistically significant there really is no effect and if we tested the entire population we would find no effect. And that 5% threshold is set at 5% to ensure that there is a high probability that we make a correct decision and that our determination of statistical significance is an accurate reflection of reality.
But mistakes can always be made. Specifically, two kinds of mistakes can be made. First, researchers can make a Type I error, which is a false positive. This happens when a researcher concludes that their results are statistically significant (there IS an effect in the population) when in reality there is no effect in the population and the results are just due to chance (that is, they are a fluke). When the significance threshold is set to 5%, which is the convention, the boundaries for making a Type I error are 5% chance or less. You might wonder why researchers don’t set it even lower to reduce the chances of making a Type I error. The reason is because when the chances of making a Type I error are reduced, the chances of making a Type II error are increased. A Type II error can be considered a ‘missed opportunity’. This happens when a researcher concludes that their results are not statistically significant when in reality, there IS an effect in the population and they just missed detecting it. Once again, these Type II errors are more likely to occur when the threshold is set too low (e.g., set at 1% instead of 5%) and/or when the sample was too small.
8. Determine how your findings fit into the knowledge base
Since statistics are probabilistic in nature and findings can reflect both Type I or Type II errors, we cannot use the results of a single study to conclude with certainty that a theory is true. Rather theories are supported, refuted, or modified based on the results of research.
If the results are statistically significant and consistent with the hypothesis and the theory that was used to generate the hypothesis, then researchers can conclude that the theory is supported. Not only did the theory make an accurate prediction, but there is now a new phenomenon that the theory accounts for. If a hypothesis is disconfirmed in a systematic empirical study, then the theory has been weakened. It made an inaccurate prediction, and there is now a new phenomenon that it does not account for.
Although this seems straightforward, there are some complications. First, confirming a hypothesis can strengthen a theory but it can never prove a theory. In fact, scientists tend to avoid the word “prove” when talking and writing about theories. One reason for this avoidance is that the result may reflect a type I error. Another reason for this avoidance is that there may be other plausible theories that imply the same hypothesis, which means that confirming the hypothesis strengthens all those theories equally. A third reason is that it is always possible that another test of the hypothesis or a test of a new hypothesis derived from the theory will be disconfirmed. This difficulty is a version of the famous philosophical “problem of induction.” One cannot definitively prove a general principle (e.g., “All swans are white.”) just by observing confirming cases (e.g., white swans)—no matter how many. It is always possible that a disconfirming case (e.g., a black swan) will eventually come along. For these reasons, scientists tend to think of theories—even highly successful ones—as subject to revision based on new and unexpected observations.
A second complication has to do with what it means when a hypothesis is disconfirmed. According to the strictest version of the hypothetico-deductive method, disconfirming a hypothesis disproves the theory it was derived from. In formal logic, the premises “if A then B” and “not B” necessarily lead to the conclusion “not A.” If A is the theory and B is the hypothesis (“if A then B”), then disconfirming the hypothesis (“not B”) must mean that the theory is incorrect (“not A”). In practice, however, scientists do not give up on their theories so easily. One reason is that one disconfirmed hypothesis could be a missed opportunity (the result of a type II error) or it could be the result of a faulty research design. Perhaps the researcher did not successfully manipulate the independent variable or measure the dependent variable.
A disconfirmed hypothesis could also mean that some unstated but relatively minor assumption of the theory was not met. For example, if Zanib had failed to find social facilitation in cockroaches, he could have concluded that drive theory is still correct but it applies only to animals with sufficiently complex nervous systems. That is, the evidence from a study can be used to modify a theory. This practice does not mean that researchers are free to ignore disconfirmations of their theories. If they cannot improve their research designs or modify their theories to account for repeated disconfirmations, then they eventually must abandon their theories and replace them with ones that are more successful.
The bottom line here is that because statistics are probabilistic in nature and because all research studies have flaws there is no such thing as scientific proof, there is only scientific evidence.
9. Prepare for dissemination
The final step in the research process involves reporting the results. As described earlier in this chapter, results are typically reported in peer-reviewed journal articles and at conferences.
As Jhangiani et al (n.d.) mention, the most prestigious way to report one’s findings is by writing a manuscript and having it published in a peer-reviewed scientific journal. Manuscripts may be published several different types of journals. Formatting standards of the publication will depend on the professional focus. It is likely that you’ll need to review the formatting guidelines of the journal carefully prior to submitting your manuscript to ensure that you’ve addressed each specification.
Typically, a well-developed manuscript will have the following components:
-
-
-
-
- Introduction
- Literature review or thematic constructs
- Methods
- Data analysis
- Results
- Discussion
- Limitations
- Conclusion
-
-
-
Another way to report findings is by writing a book chapter that is published in an edited book. Preferably the editor of the book puts the chapter through peer review but this is not always the case and some scientists are invited by editors to write book chapters.
A fun way to disseminate findings is to give a presentation at a conference. This can either be done as an oral presentation or a poster presentation. Oral presentations involve getting up in front of an audience of fellow scientists and giving a talk that might last anywhere from 10 minutes to 1 hour (depending on the conference) and then fielding questions from the audience. Alternatively, poster presentations involve summarizing the study on a large poster that provides a brief overview of the purpose, methods, results, and discussion. The presenter stands by their poster for an hour or two and discusses it with people who pass by. Presenting one’s work at a conference is a great way to get feedback from one’s peers before attempting to undergo the more rigorous peer-review process involved in publishing a journal article.
Key Points
There’s a lot to consider when you enter the world of research. However, as with most things, practice makes perfect, or at least a 95% chance of success (see what I did there?). As you move forward in this book, or simply refer back to this chapter, here are some things to remember:
- Moving from research consumer to research contributor requires a shift in mindset from ‘I want answers’ to ‘I have a question’.
- The process of research is not always linear. Rather, depending on the breadth and depth of your investigation, you may find yourself back at the beginning several times. The process of identifying a research problem, purpose, and question is an iterative process.
- Steps to the research process include:
- Determining an area of interest
- Determining your orientation to that interest
- Digging through the existing base of literature related to your interest
- Gathering enough information to help you establish
- A problem statement
- A purpose statement
- A research question
- Establishing the context for your research
- Establishing the ‘HOW’
- Gathering and analyzing your data
- Determining how your findings fit into the base of knowledge
- Preparing to disseminate your work to add to the base of knowledge
- The content in this section is attributed to: Research Methods in Psychology by Rajiv S. Jhangiani, I-Chant A. Chiang, Carrie Cuttler, & Dana C. Leighton is licensed under a Creative Commons Attribution-NonCommercial-ShareAlike 4.0 International License, except where otherwise noted. ↵
- Some of the content in this section is attributed to: Research Methods in Psychology by Rajiv S. Jhangiani, I-Chant A. Chiang, Carrie Cuttler, & Dana C. Leighton is licensed under a Creative Commons Attribution-NonCommercial-ShareAlike 4.0 International License, except where otherwise noted ↵
- Some of the content in this section is attributed to: Research Methods in Psychology by Rajiv S. Jhangiani, I-Chant A. Chiang, Carrie Cuttler, & Dana C. Leighton is licensed under a Creative Commons Attribution-NonCommercial-ShareAlike 4.0 International License, except where otherwise noted ↵
A literature-based concern that is applicable to a wide-audience (e.g. a profession)
A statement which summarizes how your work will address the problem you've identified
Ideas or concepts which are not directly measurable
A measurable representation of an abstract construct
A variable that can explain another variable. A variable which may be manipulated (active) or describes (attribute) to affect an outcome
The variable which is measured as an outcome and is affected by the independent variable(s)
Variables that are explained by both the independent and dependent variables
A variable which has an impact on the dependent variable, but does not explain the outcome (dependent variable)
The ENTIRE group you wish to study
A smaller subgroup of the population that you want to study. Ideally, the sample selected is representative of the population
The articulation of your inquiry. A focused representation of what you hope to find with your investigation.
An approach which seeks to make comparisons or search for relationships between variables.
An approach that seeks to explore or describe an experience, usually with subjective measurement tools.
An educated method of explaining or rationalizing something
How accurately a method measures what it is intended to measure
The degree to which we can confidently infer a causal relationship between variables
The degree to which the results can be generalized beyond the context of the specific study.
Statistical approaches which summarize or describe the data
Statistical approaches that draw inference from the sample to the population
Most frequently occurring score in a distribution
Midpoint of all scores within a data set
The average of a distribution
Measures the distance between the highest and lowest scores of a distribution
Distance of scores from the mean
Describes the strength and direction of the relationship between two variables
A set threshold at which a result of a statistical test is unlikely to be due to random chance
A false positive result. Identifying a significance when there is NOT significance
Not identifying significance where significance exists