
5 Approaching Survey Research
What Is Survey Research?
Survey research is a quantitative and qualitative method with two important characteristics. First, the variables of interest are measured using self-reports (using questionnaires or interviews). In essence, survey researchers ask their participants (who are often called respondents in survey research) to report directly on their own thoughts, feelings, and behaviors. Second, considerable attention is paid to the issue of sampling. In particular, survey researchers have a strong preference for large random samples because they provide the most accurate estimates of what is true in the population. Beyond these two characteristics, almost anything goes in survey research. Surveys can be long or short. They can be conducted in person, by telephone, through the mail, or over the Internet. They can be about voting intentions, consumer preferences, social attitudes, health, or anything else that it is possible to ask people about and receive meaningful answers. Although survey data are often analyzed using statistics, there are many questions that lend themselves to more qualitative analysis.
Most survey research is non-experimental. It is used to describe single variables (e.g., the percentage of voters who prefer one presidential candidate or another, the prevalence of schizophrenia in the general population, etc.) and also to assess statistical relationships between variables (e.g., the relationship between income and health). But surveys can also be used within experimental research; as long as there is manipulation of an independent variable (e.g. anger vs. fear) to assess an effect on a dependent variable (e.g. risk judgments).
Chapter 5: Learning Objectives
If your research question(s) center on the experience or perception of a particular phenomenon, process, or practice, utilizing a survey method may help glean useful data. After reading this chapter, you will
- Identify the purpose of survey research
- Describe the cognitive processes involved in responding to questions
- Discuss the importance of context in drafting survey items
- Contrast the utility of open and closed ended questions
- Describe the BRUSO method of drafting survey questions
- Describe the format for survey questionnaires
The heart of any survey research project is the survey itself. Although it is easy to think of interesting questions to ask people, constructing a good survey is not easy at all. The problem is that the answers people give can be influenced in unintended ways by the wording of the items, the order of the items, the response options provided, and many other factors. At best, these influences add noise to the data. At worst, they result in systematic biases and misleading results. In this section, therefore, we consider some principles for constructing surveys to minimize these unintended effects and thereby maximize the reliability and validity of respondents’ answers.
Cognitive Processes of Responses
To best understand how to write a ‘good’ survey question, it is important to frame the act of responding to a survey question as a cognitive process. That is, there are are involuntary mechanisms that take place when someone is asked a question. Sudman, Bradburn, & Schwarz (1996, as cited in Jhangiani et. al, 2012) illustrate this cognitive process here.
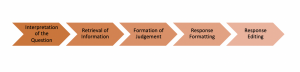
Framing the formulation of survey questions in this way is extremely helpful to ensure that the questions posed on your survey glean accurate information.
Example of a Poorly Worded Survey Question
How many alcoholic drinks do you consume in a typical day?
- A lot more of average
- Somewhat more than average
- Average number
- Somewhat fewer than average
- A lot fewer than average
Although this item at first seems straightforward, it poses several difficulties for respondents. First, they must interpret the question. For example, they must decide whether “alcoholic drinks” include beer and wine (as opposed to just hard liquor) and whether a “typical day” is a typical weekday, typical weekend day, or both. Even though Chang and Krosnick (2003, as cited in Jhangiani et al. 2012) found that asking about “typical” behavior has been shown to be more valid than asking about “past” behavior, their study compared “typical week” to “past week” and may be different when considering typical weekdays or weekend days). Once respondents have interpreted the question, they must retrieve relevant information from memory to answer it. But what information should they retrieve, and how should they go about retrieving it? They might think vaguely about some recent occasions on which they drank alcohol, they might carefully try to recall and count the number of alcoholic drinks they consumed last week, or they might retrieve some existing beliefs that they have about themselves (e.g., “I am not much of a drinker”). Then they must use this information to arrive at a tentative judgment about how many alcoholic drinks they consume in a typical day. For example, this mental calculation might mean dividing the number of alcoholic drinks they consumed last week by seven to come up with an average number per day. Then they must format this tentative answer in terms of the response options actually provided. In this case, the options pose additional problems of interpretation. For example, what does “average” mean, and what would count as “somewhat more” than average? Finally, they must decide whether they want to report the response they have come up with or whether they want to edit it in some way. For example, if they believe that they drink a lot more than average, they might not want to report that for fear of looking bad in the eyes of the researcher, so instead, they may opt to select the “somewhat more than average” response option.
From this perspective, what at first appears to be a simple matter of asking people how much they drink (and receiving a straightforward answer from them) turns out to be much more complex.
Context Effects on Survey Responses
Again, this complexity can lead to unintended influences on respondents’ answers. These are often referred to as context effects because they are not related to the content of the item but to the context in which the item appears (Schwarz & Strack, 1990, as cited in Jhangiani et al. 2012). For example, there is an item-order effect when the order in which the items are presented affects people’s responses. One item can change how participants interpret a later item or change the information that they retrieve to respond to later items. For example, researcher Fritz Strack and his colleagues asked college students about both their general life satisfaction and their dating frequency (Strack, Martin, & Schwarz, 1988, as cited in Jhangiani et al. 2012) . When the life satisfaction item came first, the correlation between the two was only −.12, suggesting that the two variables are only weakly related. But when the dating frequency item came first, the correlation between the two was +.66, suggesting that those who date more have a strong tendency to be more satisfied with their lives. Reporting the dating frequency first made that information more accessible in memory so that they were more likely to base their life satisfaction rating on it.
The response options provided can also have unintended effects on people’s responses (Schwarz, 1999, as cited in Jhangiani et al. 2012) . For example, when people are asked how often they are “really irritated” and given response options ranging from “less than once a year” to “more than once a month,” they tend to think of major irritations and report being irritated infrequently. But when they are given response options ranging from “less than once a day” to “several times a month,” they tend to think of minor irritations and report being irritated frequently. People also tend to assume that middle response options represent what is normal or typical. So if they think of themselves as normal or typical, they tend to choose middle response options. For example, people are likely to report watching more television when the response options are centered on a middle option of 4 hours than when centered on a middle option of 2 hours. To mitigate against order effects, rotate questions and response items when there is no natural order. Counterbalancing or randomizing the order of presentation of the questions in online surveys are good practices for survey questions and can reduce response order effects that show that among undecided voters, the first candidate listed in a ballot receives a 2.5% boost simply by virtue of being listed first!
Writing Survey Items
Types of Items
Questionnaire items can be either open-ended or closed-ended. Open-ended items simply ask a question and allow participants to answer in whatever way they choose. The following are examples of open-ended questionnaire items.
- “What is the most important thing to teach children to prepare them for life?”
- “Please describe a time when you were discriminated against because of your age.”
- “Is there anything else you would like to tell us about?”
Open-ended items are useful when researchers do not know how participants might respond or when they want to avoid influencing their responses. Open-ended items are more qualitative in nature, so they tend to be used when researchers have more vaguely defined research questions—often in the early stages of a research project. Open-ended items are relatively easy to write because there are no response options to worry about. However, they take more time and effort on the part of participants, and they are more difficult for the researcher to analyze because the answers must be transcribed, coded, and submitted to some form of qualitative analysis, such as content analysis. Another disadvantage is that respondents are more likely to skip open-ended items because they take longer to answer. It is best to use open-ended questions when the answer is unsure or for quantities which can easily be converted to categories later in the analysis.
Closed-ended items ask a question and provide a set of response options for participants to choose from.
Examples of Closed-Ended Questions
How old are you?
- Under 18
- 19-34
- 35-49
- 50-70
On a scale of 0 (no pain at all) to 10 (the worst pain ever experienced), how much pain are you in right now?
Closed-ended items are used when researchers have a good idea of the different responses that participants might make. They are more quantitative in nature, so they are also used when researchers are interested in a well-defined variable or construct such as participants’ level of agreement with some statement, perceptions of risk, or frequency of a particular behavior. Closed-ended items are more difficult to write because they must include an appropriate set of response options. However, they are relatively quick and easy for participants to complete. They are also much easier for researchers to analyze because the responses can be easily converted to numbers and entered into a spreadsheet. For these reasons, closed- ended items are much more common.
All closed-ended items include a set of response options from which a participant must choose. For categorical variables like sex, race, or political party preference, the categories are usually listed and participants choose the one (or ones) to which they belong. For quantitative variables, a rating scale is typically provided. A rating scale is an ordered set of responses that participants must choose from.
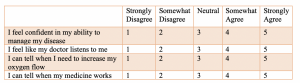
The number of response options on a typical rating scale ranges from three to 11—although five and seven are probably most common. Five-point scales are best for unipolar scales where only one construct is tested, such as frequency (Never, Rarely, Sometimes, Often, Always). Seven- point scales are best for bipolar scales where there is a dichotomous spectrum, such as liking (Like very much, Like somewhat, Like slightly, Neither like nor dislike, Dislike slightly, Dislike somewhat, Dislike very much). For bipolar questions, it is useful to offer an earlier question that branches them into an area of the scale; if asking about liking ice cream, first ask “Do you generally like or dislike ice cream?” Once the respondent chooses like or dislike, refine it by offering them relevant choices from the seven-point scale. Branching improves both reliability and validity (Krosnick & Berent, 1993, as cited in Jhangiani et al. 2012) . Although you often see scales with numerical labels, it is best to only present verbal labels to the respondents but convert them to numerical values in the analyses. Avoid partial labels or length or overly specific labels. In some cases, the verbal labels can be supplemented with (or even replaced by) meaningful graphics.
Writing Effective Items
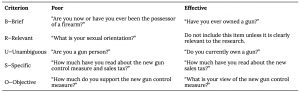
We can now consider some principles of writing questionnaire items that minimize unintended context effects and maximize the reliability and validity of participants’ responses. A rough guideline for writing 9 questionnaire items is provided by the BRUSO model (Peterson, 2000, as cited in Jhangiani et al. 2012 ) . An acronym, BRUSO stands for “brief,” “relevant,” “unambiguous,” “specific,” and “objective.” Effective questionnaire items are brief and to the point. They avoid long, overly technical, or unnecessary words. This brevity makes them easier for respondents to understand and faster for them to complete. Effective questionnaire items are also relevant to the research question. If a respondent’s sexual orientation, marital status, or income is not relevant, then items on them should probably not be included. Again, this makes the questionnaire faster to complete, but it also avoids annoying respondents with what they will rightly perceive as irrelevant or even “nosy” questions. Effective questionnaire items are also unambiguous; they can be interpreted in only one way. Part of the problem with the alcohol item presented earlier in this section is that different respondents might have different ideas about what constitutes “an alcoholic drink” or “a typical day.” Effective questionnaire items are also specific so that it is clear to respondents what their response should be about and clear to researchers what it is about. A common problem here is closed- ended items that are “double barreled.” They ask about two conceptually separate issues but allow only one response.
Example of a “Double Barreled” question
Please rate the extent to which you have been feeling anxious and depressed
- Very
- Somewhat
- Not at all
Note: The issue in the question itself is that anxiety and depression are two separate items and should likely be separated
Finally, effective questionnaire items are objective in the sense that they do not reveal the researcher’s own opinions or lead participants to answer in a particular way. The best way to know how people interpret the wording of the question is to conduct a pilot test and ask a few people to explain how they interpreted the question.
For closed-ended items, it is also important to create an appropriate response scale. For categorical variables, the categories presented should generally be mutually exclusive and exhaustive. Mutually exclusive categories do not overlap. For a religion item, for example, the categories of Christian and Catholic are not mutually exclusive but Protestant and Catholic are mutually exclusive. Exhaustive categories cover all possible responses. Although Protestant and Catholic are mutually exclusive, they are not exhaustive because there are many other religious categories that a respondent might select: Jewish, Hindu, Buddhist, and so on. In many cases, it is not feasible to include every possible category, in which case an ‘Other’ category, with a space for the respondent to fill in a more specific response, is a good solution. If respondents could belong to more than one category (e.g., race), they should be instructed to choose all categories that apply.
For rating scales, five or seven response options generally allow about as much precision as respondents are capable of. However, numerical scales with more options can sometimes be appropriate. For dimensions such as attractiveness, pain, and likelihood, a 0-to-10 scale will be familiar to many respondents and easy for them to use. Regardless of the number of response options, the most extreme ones should generally be “balanced” around a neutral or modal midpoint.
Example of an unbalanced versus balanced rating scale
Unbalanced rating scale measuring perceived likelihood
Unlikely | Somewhat Likely | Likely | Very Likely | Extremely Likely
Balanced rating scale measuring perceived likelihood
Extremely Unlikely | Somewhat Unlikely | As Likely as Not | Somewhat Likely |Extremely Likely
Note, however, that a middle or neutral response option does not have to be included. Researchers sometimes choose to leave it out because they want to encourage respondents to think more deeply about their response and not simply choose the middle option by default. However, including middle alternatives on bipolar dimensions can be used to allow people to choose an option that is neither.
Formatting the Survey
Writing effective items is only one part of constructing a survey. For one thing, every survey should have a written or spoken introduction that serves two basic functions (Peterson, 2000, as cited by Jhangiani et al. 2012). One is to encourage respondents to participate in the survey. In many types of research, such encouragement is not necessary either because participants do not know they are in a study (as in naturalistic observation) or because they are part of a subject pool and have already shown their willingness to participate by signing up and showing up for the study. Survey research usually catches respondents by surprise when they answer their phone, go to their mailbox, or check their e-mail—and the researcher must make a good case for why they should agree to participate. This means that the researcher has only a moment to capture the attention of the respondent and must make it as easy as possible for the respondent to participate. Thus the introduction should briefly explain the purpose of the survey and its importance, provide information about the sponsor of the survey (university-based surveys tend to generate higher response rates), acknowledge the importance of the respondent’s participation, and describe any incentives for participating.
The second function of the introduction is to establish informed consent. Remember that this involves describing to respondents everything that might affect their decision to participate. This includes the topics covered by the survey, the amount of time it is likely to take, the respondent’s option to withdraw at any time, confidentiality issues, and so on. Written consent forms are not always used in survey research (when the research is of minimal risk and completion of the survey instrument is often accepted by the IRB as evidence of consent to participate), so it is important that this part of the introduction be well documented and presented clearly and in its entirety to every respondent.
The introduction should be followed by the substantive questionnaire items. But first, it is important to present clear instructions for completing the questionnaire, including examples of how to use any unusual response scales. Remember that the introduction is the point at which respondents are usually most interested and least fatigued, so it is good practice to start with the most important items for purposes of the research and proceed to less important items. Items should also be grouped by topic or by type. For example, items using the same rating scale (e.g., a 5-point agreement scale) should be grouped together if possible to make things faster and easier for respondents. Demographic items are often presented last because they are least interesting to participants but also easy to answer in the event respondents have become tired or bored. Of course, any survey should end with an expression of appreciation to the respondent.
Coding your survey responses
Once you’ve closed your survey, you’ll need to identify how to quantify the data you’ve collected. Much of this can be done in ways similar to methods described in the previous two chapters. Although there are several ways by which to do this, here are some general tips:
- Transfer data: Transfer your data to a program which will allow you to organize and ‘clean’ the data. If you’ve used an online tool to gather data, you should be able to download the survey results into a format appropriate for working the data. If you’ve collected responses by hand, you’ll need to input the data manually.
- Save:ALWAYS save a copy of your original data. Save changes you make to the data under a different name or version in case you need to refer back to the original data.
- De-identify: This step will depend on the overall approach that you’ve taken to answer your research question and may not be appropriate for your project.
- Name the variables: Again, there is no ‘right’ way to do this; however, as you move forward, you will want to be sure you can easily identify what data you are extracting. Many times, when you transfer your data the program will automatically associate data collected with the question asked. It is a good idea to name the variable something associated with the data, rather than the question
- Code the attributes: Each variable will likely have several different attributes, or layers. You’ll need to come up with a coding method to distinguish the different responses. As discussed in previous chapters, each attribute should have a numeric code associated so that you can quantify the data and use descriptive and/or inferential statistical methods to either describe or explore relationships within the dataset.
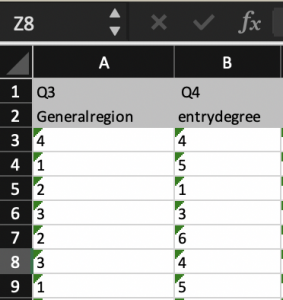
This is relatively simple to accomplish with closed-ended questions. Because you’ve ‘forced’ the respondent to pick a concrete answer, you can create a code that is associated with each answer. In the picture above, respondents were asked to identify their region and given a list of geographical regions and in structed to pick one. The researcher then created a code for the regions. In this case, 1= West; 2= Midwest; 3= Northeast; 4= Southeast; and 5= Southwest. If you’re working to quantify data that is somewhat qualitative in nature (i.e. open ended questions) the process is a little more complicated. You’ll need to either create themes or categories, classify types or similar responses, and then assign codes to those themes or categories.
6. Create a codebook: This.is.essential. Once you begin to code the data, you will have somewhat disconnected yourself from the data by translating the data from a language that we understand to a language which a computer understands. Af ter you run your statistical methods, you’ll translate it back to the native language and share findings. To stay organized and accurate, it is important that you keep a record of how the data has been translated.
7. Analyze: Once you have the data inputted, cleaned, and coded, you should be ready to analyze your data using either descriptive or inferential methods, depend. ing on your approach and overarching goal.
Key Takeaways
- Surveys are a great method to identify information about perceptions and experiences
- Question items must be carefully crafted to elicit an appropriate response
- Surveys are often a mixed-methods approach to research
- Both descriptive and inferential statistical approaches can be applied to the data gleaned through survey responses
- Surveys utilize both open and closed ended questions; identifying which types of questions will yield specific data will be helpful as you plan your approach to analysis
- Most surveys will need to include a method of informed consent, and an introduction. The introduction should clearly delineate the purpose of the survey and how the results will be utilized
- Pilot tests of your survey can save you a lot of time and heartache. Pilot testing helps to catch issues in the development of item, accessibility, and type of information derived prior to initiating the survey on a larger scale
- Survey data can be analyzed much like other types of data; following a systematic approach to coding will help ensure you get the answers you’re looking for
- This section is attributed to Research Methods in Psychology by Rajiv S. Jhangiani, I-Chant A. Chiang, Carrie Cuttler, & Dana C. Leighton is licensed under a Creative Commons Attribution-NonCommercial-ShareAlike 4.0 International License, except where otherwise noted. ↵
- The majority of content in these sections can be attributed to Research Methods in Psychology by Rajiv S. Jhangiani, I-Chant A. Chiang, Carrie Cuttler, & Dana C. Leighton is licensed under a Creative Commons Attribution-NonCommercial-ShareAlike 4.0 International License, except where otherwise noted. ↵
A mixed methods approach using self-reports of respondents who are sampled using stringent methods
A type of survey question that allows the respondent to insert their own response; typically qualitative in nature
A type of survey question which forces a respondent to select a response; no subjectivity.