
3 Gathering and Analyzing Quantitative Data
Although the goal of any research study is to gather information to analyze, this process can be a little daunting. Hopefully, you’ve taken the time to plan your approach so that you have a clear plan for the type of information you’ll be gathering and the process by which you will assign meaning and glean an understanding about what you’ve collected. As was the case with designing your approach to your study, a systematic method by which you plan the analysis of your data will make your life a whole lot easier. This chapter will provide a basic overview of how to gather data and begin the analysis of those data with an overview of quantitative statistical approaches.
Chapter 3: Learning Objectives
As you work to understand how best to approach gathering and analyzing quantitative data you will:
- Describe the methodology of developing measurement instruments to gather and quantify data
- Discuss the factors that influence the coding process
- Describe how relationships between dependent and independent variables influence selection of statistical approach
- Compare questions of difference, association, and description
- Identify both basic and complex statistical approaches specific to a research question
Basic Approaches to Gathering and Analyzing Quantitative Data
Developing or Selecting Measurement Instruments
There are several methods by which data can be gathered. These methods will be directed by the approach you’ve taken as well as the question you’re investigating. Methods by which data may be gathered include, but are not limited to:
- Case or patient specific information
- Questionnaires or surveys
- Structured interviews
- Observations
- Tests
- Standardized inventories
The method by which you will gather data is hugely important to the validity of your results. Ideally, a researcher would utilize established measurement tools which have been validated through consistent study. However, this is not always feasible. When you cannot utilize a validated instrument (e.g. a common questionnaire or scale) to measure variables in your specific sample, the instrument you either revise or develop should at least be pilot tested. Pilot testing is a procedure by which measurement tools or instruments are implemented on a small scale to evaluate the feasibility and identify adverse events in design prior to implementing the tool in a larger study.
Collecting Data
Again, the type and amount of data will depend on the approach you’ve selected. Regardless of this, however, all data will need to be checked to ensure that it is ‘clean’. This means removing duplicated responses or entries or other erroneous or inconsistent data that may impact your ability to analyze. Note: You should never change or alter data collected. Rather, if there are inconsistencies in how you expected the data to be collected, you must decide how to deal with those issues before moving forward.
Dealing with Data Collection Issues
You have asked respondents how well the training you provided met the objectives outlined at the beginning of the course using a likert scale (1=strongly disagree; 5= strongly agree). You have several respondents who encircled 4 and 5. You now have to decide what to do with this data. You have a few options:
- Create a new category of scores using the average of 4+5 (9/2=4.5)
- You can exclude all respondents who did this
Note: When designing questionnaires or surveys, it is essential to ensure that the questions are clear and concise by utilizing directive language such as, “Select the option most appropriate…”, or “Which ONE of the following”.
Data must then be transferred into a format where it can be sorted and analyzed. The most common approaches to this is to either input or export data to software such as Microsoft Excel(TM) or specialized statistical software such as Statistical Packages for the Social Sciences (SPSS) (TM).
Data Input
Data may be entered either manually or electronically imported to analysis software:
Coding
Coding may be thought of as the process of translating the information you’ve gathered such that variables can ‘talk’ to one another through analysis. This is done by numbers to the attributes, or layers, within a variable. There are a few rules governing how this is done:
- Each coded level within a variable must be mutually exclusive: Only one value can be used to code each layer within a variable
Mutually Exclusive Coding
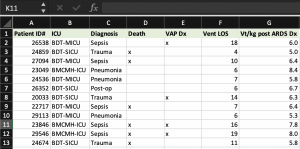
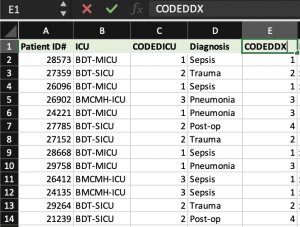
In our dataset example, patients may only be in one location, so you can code the each layer exclusively:
- BDT-MICU (Coded as ‘1’)
- BDT-SICU (Coded as ‘2’)
- BMCMH-ICU (Coded as ‘3’)
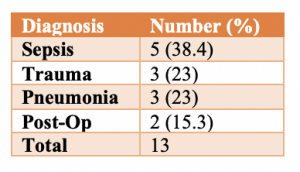
Similarly, each diagnosis may be coded independently:
- Sepsis (Coded as ‘1’)
- Trauma (Coded as ‘2’)
- Pneumonia (Coded as ‘3’)
- Post-Op (Coded as ‘4’)
There are instances wherein more than one response is indicated or where there may be a designation within each variable. In these cases, each designation would need to have a separate code (e.g. ‘yes’/’no’). In our example, patients either have ventilator associated pneumonia (VAP), or they did not. Similarly, patients either died, or did not. You will need to code each layer to indicate whether it was experienced:
- VAP (yes= ‘1’, no= ‘0’)
- Death (yes= ‘1’, no= ‘0’)
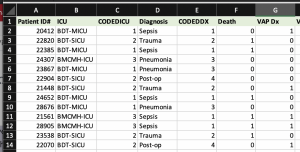
2. For each variable entered, there must be a code assigned: Numeric codes need to be applied to all data entries, except for missing responses. In the case of missing data, leave the cell blank. Leaving the cell blank ensures that the item will be counted as ‘missing’ rather than associated with a different code. Depending on the software being used, designating missing data as ‘N/A’ may result in errors during analysis.
3. Coding needs to be consistent: As you make decisions about how to proceed with your data, it is imperative that your decisions are consistent across the entire data set. For example, if you decide that you will be excluding a participant with missing data, you must exclude all missing data.
4. Data relating to specific cases or responses must be organized: Each variable relating to a participant must be organized in a way which relates to that participant. For our example above, patients are indicated in column ‘A’. Subsequent columns are variables which relate to that patient; however, each piece of data relating to the specific patient is indicated in the row associated with that specific patient. This is important to ensure that data is correctly attributed during analyses.
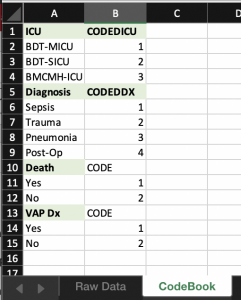
5. Variables need to be labeled appropriately: It’s common to need to abbreviate the names of variables. Do this in a way which helps you remain organized. If you want to keep the data one one sheet, you can simply add a coded column next to the original variable. Or, you can begin an entirely new spreadsheet of coded variables. Regardless of ;approach, you’ll need to keep a record of how you’ve changed variable names and assigned codes. Creating a codebook will help you recall which codes were assigned to which attributes so that you can correctly interpret analyses.
Creating a Codebook
Creating a codebook is imperative to ensuring you can correctly interpret the analyses you perform on the data
Selecting the Appropriate Statistical Method
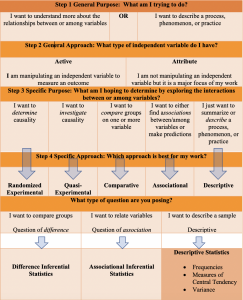
In chapter 2, we discussed three types of general statistical approaches:
- Experimental: Has an active independent variable. The purpose of the study is to manipulate the independent variable to evaluate the impact of that variable on the dependent variable; may experimental (randomized sampling) or quasi-experimental (sample not randomized)
- Non-Experimental: Has an attribute independent variable rather than an active independent variable. The purpose of the study is to explore relationships among variables. Survey and observational research fit into this category.
- Descriptive: Does not have an independent variable. The purpose of descriptive research is to describe a selected sample rather than make inferences about that sample to the population.
We also discussed five types of specific approaches:
- Randomized experimental
- Quasi-experimental
- Comparative
- Associational/Correlational
- Descriptive
If you recall, we underscored that the type of question central to your work guides the selection of your research approach. Similarly, the type of question you’re asking will help to guide your selection of appropriate statistical approaches to analyze the data you’ve collected. There are three main types of questions and it’s important to note that a research project may incorporate several different statistical approaches, depending on the type of question(s) asked.
Adding to the chart introduced in chapter two, information relating to the purpose of the research question, we can identify the next step in identifying the most appropriate statistical approach.
Descriptive questions
Descriptive questions seek to describe a specific sample. Descriptive statistics include measures of central tendency and variability.
Examples of Descriptive Statistics
- Frequency distributions
- This is a description of the number of participants who fit into any one attribute or variable. This number may include the percentage of the sample that this number represents
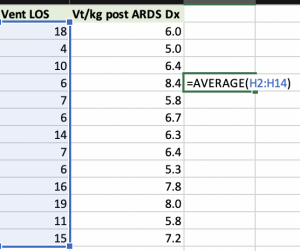
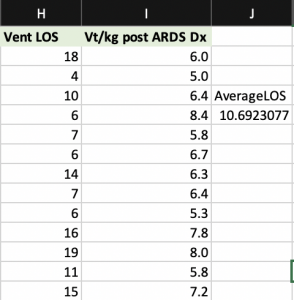
- Measures of Central Tendency
- What is the tendency of the data to cluster around certain values (i.e. mean, median, and mode)?
- Mean= Average (sum of the measurements divided by the number of entries) of all numerical data included for a specific variable
-
- Median= The middle number when numeric data are arranged in either ascending or descending order
-
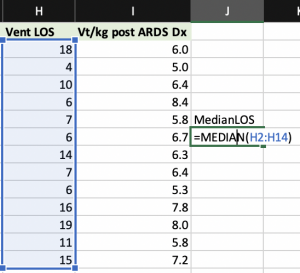
Calculating the Median 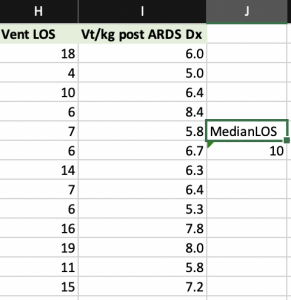
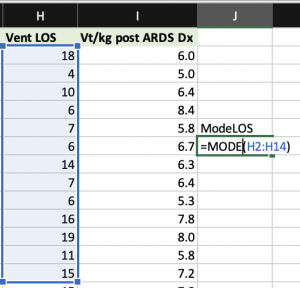
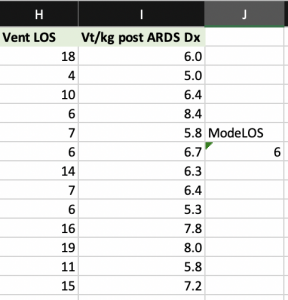
Designation of the median - Mode: The measurement that occurs most frequently in a set of data
- What is the tendency of the data to cluster around certain values (i.e. mean, median, and mode)?
- Variability: Describes the spread of scores within a data set
- Standard deviation is the most common when the data is normally distributed
Questions of difference
Answers to these questions center on the comparison of groups and the difference between those groups. Randomized experimental, quasi-experimental, and comparative approaches support questions of difference and therefore, use similar statistical approaches. Questions of difference utilize difference inferential statistics because the goal is to compare groups’ average scores on a dependent variable.
The selection of either basic or complex difference statistics will depend on how many independent and/or independent variables you are comparing:
One dependent and/or independent variable
As we’ve discussed, understanding the relationships between or among your dependent and independent variable(s) is extremely important. If you identify only one dependent and/or independent variable, Gliner, Morgan and Leech (2017) indicate that there are a few considerations you’ll need to investigate:
- Is your dependent variable normally distributed AND all assumptions met?
- Yes?
- Do you have one independent variable with two categories?
- Yes ? Consider the following:
- Independent t-test: Used to compare means of independent samples or groups with one independent variable with two categories.
- Paired t-test: Used to compare means of repeated measures within the same group with one independent variable with two categories.
- Yes ? Consider the following:
- Do you have one independent variable with two or more categories?
- Yes ? Consider the following:
- One way ANOVA: Used to compare means of independent samples or groups with one independent variable that has two or more categories.
- Repeated Measures ANOVA: Used to compare means of repeated measures or related samples with one independent variable that has two or more categories.
- Yes ? Consider the following:
- Is your dependent variable ordinal or not normally distributed?
- Yes?
- Are you comparing medians or ranks?
- Yes
- Do you have one independent variable with two categories?
- Yes? Consider the following:
- Mann-Whitney can be used to compare medians or ranks of groups with one independent variable that has two categories.
- Wilcoxon or Sign test can be used to compare medians or ranks within groups which have one independent variable with two categories
- Yes? Consider the following:
- Do you have one independent variable with two or more categories?
- Yes? Consider the following
- Kruskal-Wallis can be used to compare medians or ranks of independent samples with one independent variable but that has two or more categories.
- Friedman test can be used to compare medians or ranks for repeated measures or related samples with one independent variable that has two or more categories.
- Yes? Consider the following
- Are you comparing medians or ranks?
- Yes?
- Is your dependent variable nominal (categorical)?
- Yes?
- Are you comparing counts?
- Yes?
- Do you have one independent variable with two categories?
- Yes? Consider the following:
- Chi Square or Fisher’s exact test can be used to compare counts within groups which have one independent variable with two categories. Chi square is a nonparametric test (used when sample is NOT normally distributed)
- Mcnemar can be used to compare counts within groups which have one independent variable with two categories.
- Yes? Consider the following:
- Do you have one independent variable with two or more categories?
- Chi Square can also be used to compare counts of independent samples with one independent variable but with that has two or more categories.
- Cochran Q Test can be used to compare counts for repeated measures or related samples with one independent variable that has two or more categories.
- Are you comparing counts?
- Yes?
More than one independent and/or dependent variable
The inclusion of more than one independent and/or dependent variable will require the use of fairly complex statistical tests such as:
- Factorial ANOVA with or without repeated measures
- Factorial ANOVA can be used to measure two or more independent variables between groups when you have one dependent variable; assuming normal distribution.
- Factorial ANOVA with repeated measures can be used to explore means of groups that are related, have one dependent variable, and two or more independent variables
- Log Linear
- Log linear should only be used with a dependent variable is nominal and you are looking at differences between groups with more than two independent variables.
- MANOVA with or without repeated measures
- MANOVA can be used in when looking at differences between groups with several dependent variables and two or more independent variables.
- MANOVA with repeated measures can be used in when looking at differences within a group and has several dependent variables as well as two or more independent variables.
Questions of association
Answers to these questions seek to identify whether there is an association or correlation between at least two variables. Associational inferential statistics can also be used to help predict associations between variables.
The selection of either basic or complex difference statistics will depend on how many independent variables are included in your work (Gliner, Morgan, & Leech, 2017):
Only one independent variable
- Both variables nominal?
-
- Yes? Consider the following:
- Pearson r or Bivariate regression to investigate the relationship between two variables for the same subject
- Yes? Consider the following:
-
- Both variables ordinal?
-
- Yes? Consider the following:
- Spearman (Rho) or Kendall’s Tau can be used to explore the relationship between the ranks of two variables for the same subject
- Yes? Consider the following:
-
- One or both variables nominal?
-
- Yes? Consider the following:
- Phi or Cramer's V can be used to identify relationships between the counts of two variables for the same subject.
- Yes? Consider the following:
-
Several independent variables
One continuous dependent variable?
- Multiple Regression: Used to predict the value of a variable based on the value of two or more other variables
One dichotomous dependent variable?
- Discriminant analysis: Use with normally distributed independent variables
- Logistic regression: Use when some independent variables are normal and some dichotomous or when ALL independent variables are dichotomous
Making it as easy as possible:
Although there are several factors that influence the selection of a statistical test, there are general questions you can ask to help guide your decision. We’ve covered several of those steps throughout this chapter; however, the figure below, adapted from Salkind and Frey (2020), can be thought of as a quick reference:
. Statistics for people who (think they) hate statistics. Sage Publications")
Additional how-to:
Now that you understand the basic concepts of choosing a statistical approach, you will be able to move forward. Although there are several conditions specific to your work which will impact your choices, understanding the general approach and considerations is the focus of this text. Additional information about which statistical tests are most appropriate for your specific design, as well as information about how to perform and interpret specific statistics can be found here: Choosing the correct statistical test
Key Takeaways
- Data must be collected systematically and prepared for analysis
- Coding is an important step in preparing your data for analysis and must be:
- Mutually exclusive
- Numeric and applied to each entry
- Consistent
- Organized
- The statistical approach you select will be guided by the study approach you selected and the question you’re asking
- Questions can either be of difference, association, or descriptive
- There are both basic and complex statistical approaches for both questions of difference and association
- You must understand the relationship between your dependent and independent variable(s) to identify the most appropriate statistical test
- The selection of statistical approaches is not ‘one-size-fits all’ and requires specific attention to be paid to the variables specific to the work
References
Bhattacherjee, A. (2012). Social science research: Principles, methods, and practices. https://open.umn.edu/opentextbooks/textbooks/social-science-research-principles-methods-and-practices
Gliner, J.A., Morgan, G.A., & Leech, N.L. (2017). Research methods in applied settings: An integrated approach to design and analysis. Routledge
Salkind, N.J. & Frey, B.B. (2020). Statistics for people who think they hate statistics. Sage Publications
An initial study performed prior to implementing a large scale study to evaluate the feasibility of the approach on a larger scale
Compares means of at least two different samples or groups with one independent variables with two categories
Compare the means of the same group with two different data points (e.g. pre and post test scores).
Compares the means of different samples with one independent variable which has two or more categories.
Compares means of related or the same group with one independent variable that has two or more categories
Compares medians or ranks within groups which have one independent variable with two categories
Compares medians within a group that has one independent variable with two categories
Compares medians of different samples with one independent variable with two or more categories
Compares counts within groups with have one independent variable with two categories
Can be used when looking at differences either within or between groups with several dependent variables and two or more independent variables
Evaluates the relationship between two variables for the same subject
Explores relationship between ranks of two variables on the same subject
Identifies relationships between the counts of two variables with for the same subject
Used to predict the value of a variable based on the value of two or more other variables
Used to classify observations into non-overlapping groups, based on scores on one or more quantitative predictor variables
Uses a logistic function to model a binary dependent variable