
2.3 Methods and Data
Anthropologists use many different methods to study the world, but they can be broken down into two main types – quantitative and qualitative. The data collected can also be broken down into these categories. This may depend on the method used, but it is possible to complete mixed methods research resulting in both types of data. This is particularly common with surveys.
Quantitative Methods and Data
Quantitative methods and data are those that seek to measure and count. For example, if we visited the roster for your class, we might count how many names start with A-M and how many names start with N-Z. While this information might not be terribly useful, it would be quantitative in nature.
Anthropologists use quantitative approaches for all sorts of things. We might want to know the range of a population’s height, find the average, then compare that average to a different population. For example, are men taller than women? On average, yes.
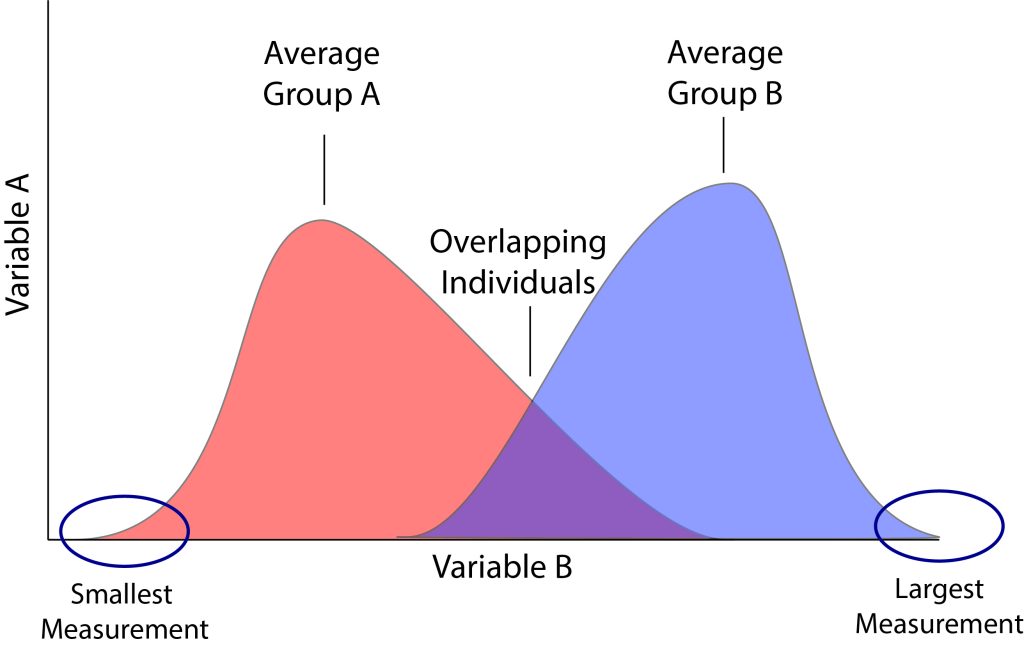
It’s important to note that comparison between groups is done using the average, not the whole. As a result, a tall woman may be the same height as the average man, and a short man may be shorter than the average woman. This does not negate the fact that, on average, men are taller than women. This is why qualitative data is also important – it can seek to explore individual variation in more detail.
For example, if we look at the figure below, we can see that Group A and Group B both have a statistical average which we can compare. However, there is also an area with individuals who overlap (e.g., short men and tall women). There are also fewer individuals at the shortest or largest measurements – the tails – of the distribution chart. Therefore, we can study and talk about averages so long as we also keep in mind that there are also exceptions to these results. Ultimately, both are correct.
Quantitative methods include surveys, anthropometrics, counting individuals in a group or number of occurrences of a behavior, and demographics. This results in statistical data that can be compared within or between groups. In general, quantitative methods result in large samples so scientists can find or test broader patterns. This data can then be used to solve real world problems. Did you ever wonder how companies figured out the ideal desk height for the average person?
Qualitative Methods and Data
Qualitative methods and data are those that seek to describe and provide rich detail of an event or ideology. For example, if I want to understand your experience as a college student, it would be better to talk to you or ask you open-ended questions on a survey. This contrasts with a quantitative approach where I might ask, “How much do you like college?” with options ranging from “very much” to “not at all.”
Anthropologists use qualitative approaches to find the nuance of the human experience. Perhaps we want to understand how a group defines family, what impacts their decision-making, or how they prepare food. These are concepts like individual experience, ideologies, etc. that are hard to quantify but can be described in detail. Being qualitative does not mean the data is irrelevant.
For example, scientists have noticed that people are having fewer children in many societies. Quantitative data suggests these drops in total fertility rate are connected to increases in educational access and urbanization. Yet only interviews could help us unpack why people may choose to have fewer children – if any at all.
Qualitative methods include interviews, participant observations, ethnography, social network analysis, and the collection of one’s life history experiences. Due to the effort required to document individual experiences at length, qualitative methods often result in smaller, more narrative data sets.
Relating to, measuring, or measured by the quantity of something rather than its quality; data that is primarily numeric in nature; counting.
Relating to, measuring, or measured by the quality of something rather than its quantity; the narrative or rich quality of something; descriptive.
Of or relating to the scientific study of the measurements and proportions of the human body. (Oxford Languages)
Statistical data relating to the population and particular groups within it. (Oxford Languages)
Ex. Age, Zip Code, Sex, Gender, Education, Income.
A research technique characterized by the effort of an investigator to gain entrance into and social acceptance by a foreign culture or alien group so as better to attain a comprehensive understanding of the internal structure of the society.
The study and systematic recording of human cultures; also a descriptive work produced from such research. (Merriam Webster)
Narrative, rich description of the lifeways of other groups/cultures. (Volsche)
The process of investigating social structures through the use of networks and graph theory.
