
5 Analysis of Enzymes Using Peroxidase
Enzymes are molecules that regulate the chemical reactions that occur in all living organisms. Enzymes act as catalysts, substances that speed up chemical reactions. Enzymes catalyze reactions by reducing the activation energy for a specific reaction to occur and yet are neither destroyed nor altered during this process. At the molecular level, enzymes catalyze these reactions by briefly binding to the substrate or reactants to form an enzyme-substrate complex. The reaction takes place while the substrate is bound to the enzyme, converting the substrate to the new product. The new product is then released from the enzyme substrate complex and the enzyme is then free to bind with more substrate.
Enzyme + Substrate –> Enzyme-Substrate Complex –> Enzyme + Product
Enzyme basics (adapted from OpenStax, CC-BY-SA)
Due to this jigsaw puzzle-like match between an enzyme and its substrates , enzymes are known for their specificity. The “best fit” results from the shape and the amino acid functional group’s attraction to the substrate. There is a specifically matched enzyme for each substrate and, thus, for each chemical reaction; however, there is flexibility as well.
The fact that active sites are so perfectly suited to provide specific environmental conditions also means that they are subject to local environmental influences. It is true that increasing the environmental temperature generally increases reaction rates, enzyme-catalyzed or otherwise. However, increasing or decreasing the temperature outside of an optimal range can affect chemical bonds within the active site in such a way that they are less well suited to bind substrates. High temperatures will eventually cause enzymes, like other biological molecules, to denature, a process that changes the substance’s natural properties. Likewise, the local environment’s pH can also affect enzyme function. Active site amino acid residues have their own acidic (low pH) or basic (high pH) properties that are optimal for catalysis. These residues are sensitive to changes in pH that can impair the way substrate molecules bind. Enzymes are suited to function best within a certain pH range, and, as with temperature, extreme environmental pH values (acidic or basic) can cause enzymes to denature.
Enzyme example: How to remove toxic hydrogen peroxide
Hydrogen peroxide (H2O2) is toxic to most living organisms. Many organisms are capable of enzymatically destroying the hydrogen peroxide before it can do much damage. Hydrogen peroxide can be converted to oxygen and water, as follows:
2 H2O2 –> 2 H2O + O2(gas)
Although this reaction occurs spontaneously, enzymes increase the rate considerably. At least two different enzymes are known to catalyze this reaction: catalase, found in animals and protists, and peroxidase, found in plants. A great deal can be learned about enzymes by studying the rates of enzyme-catalyzed reactions. Today you will use a colorimetric (color-based) assay to determine the rate of reaction of the enzyme peroxidase.
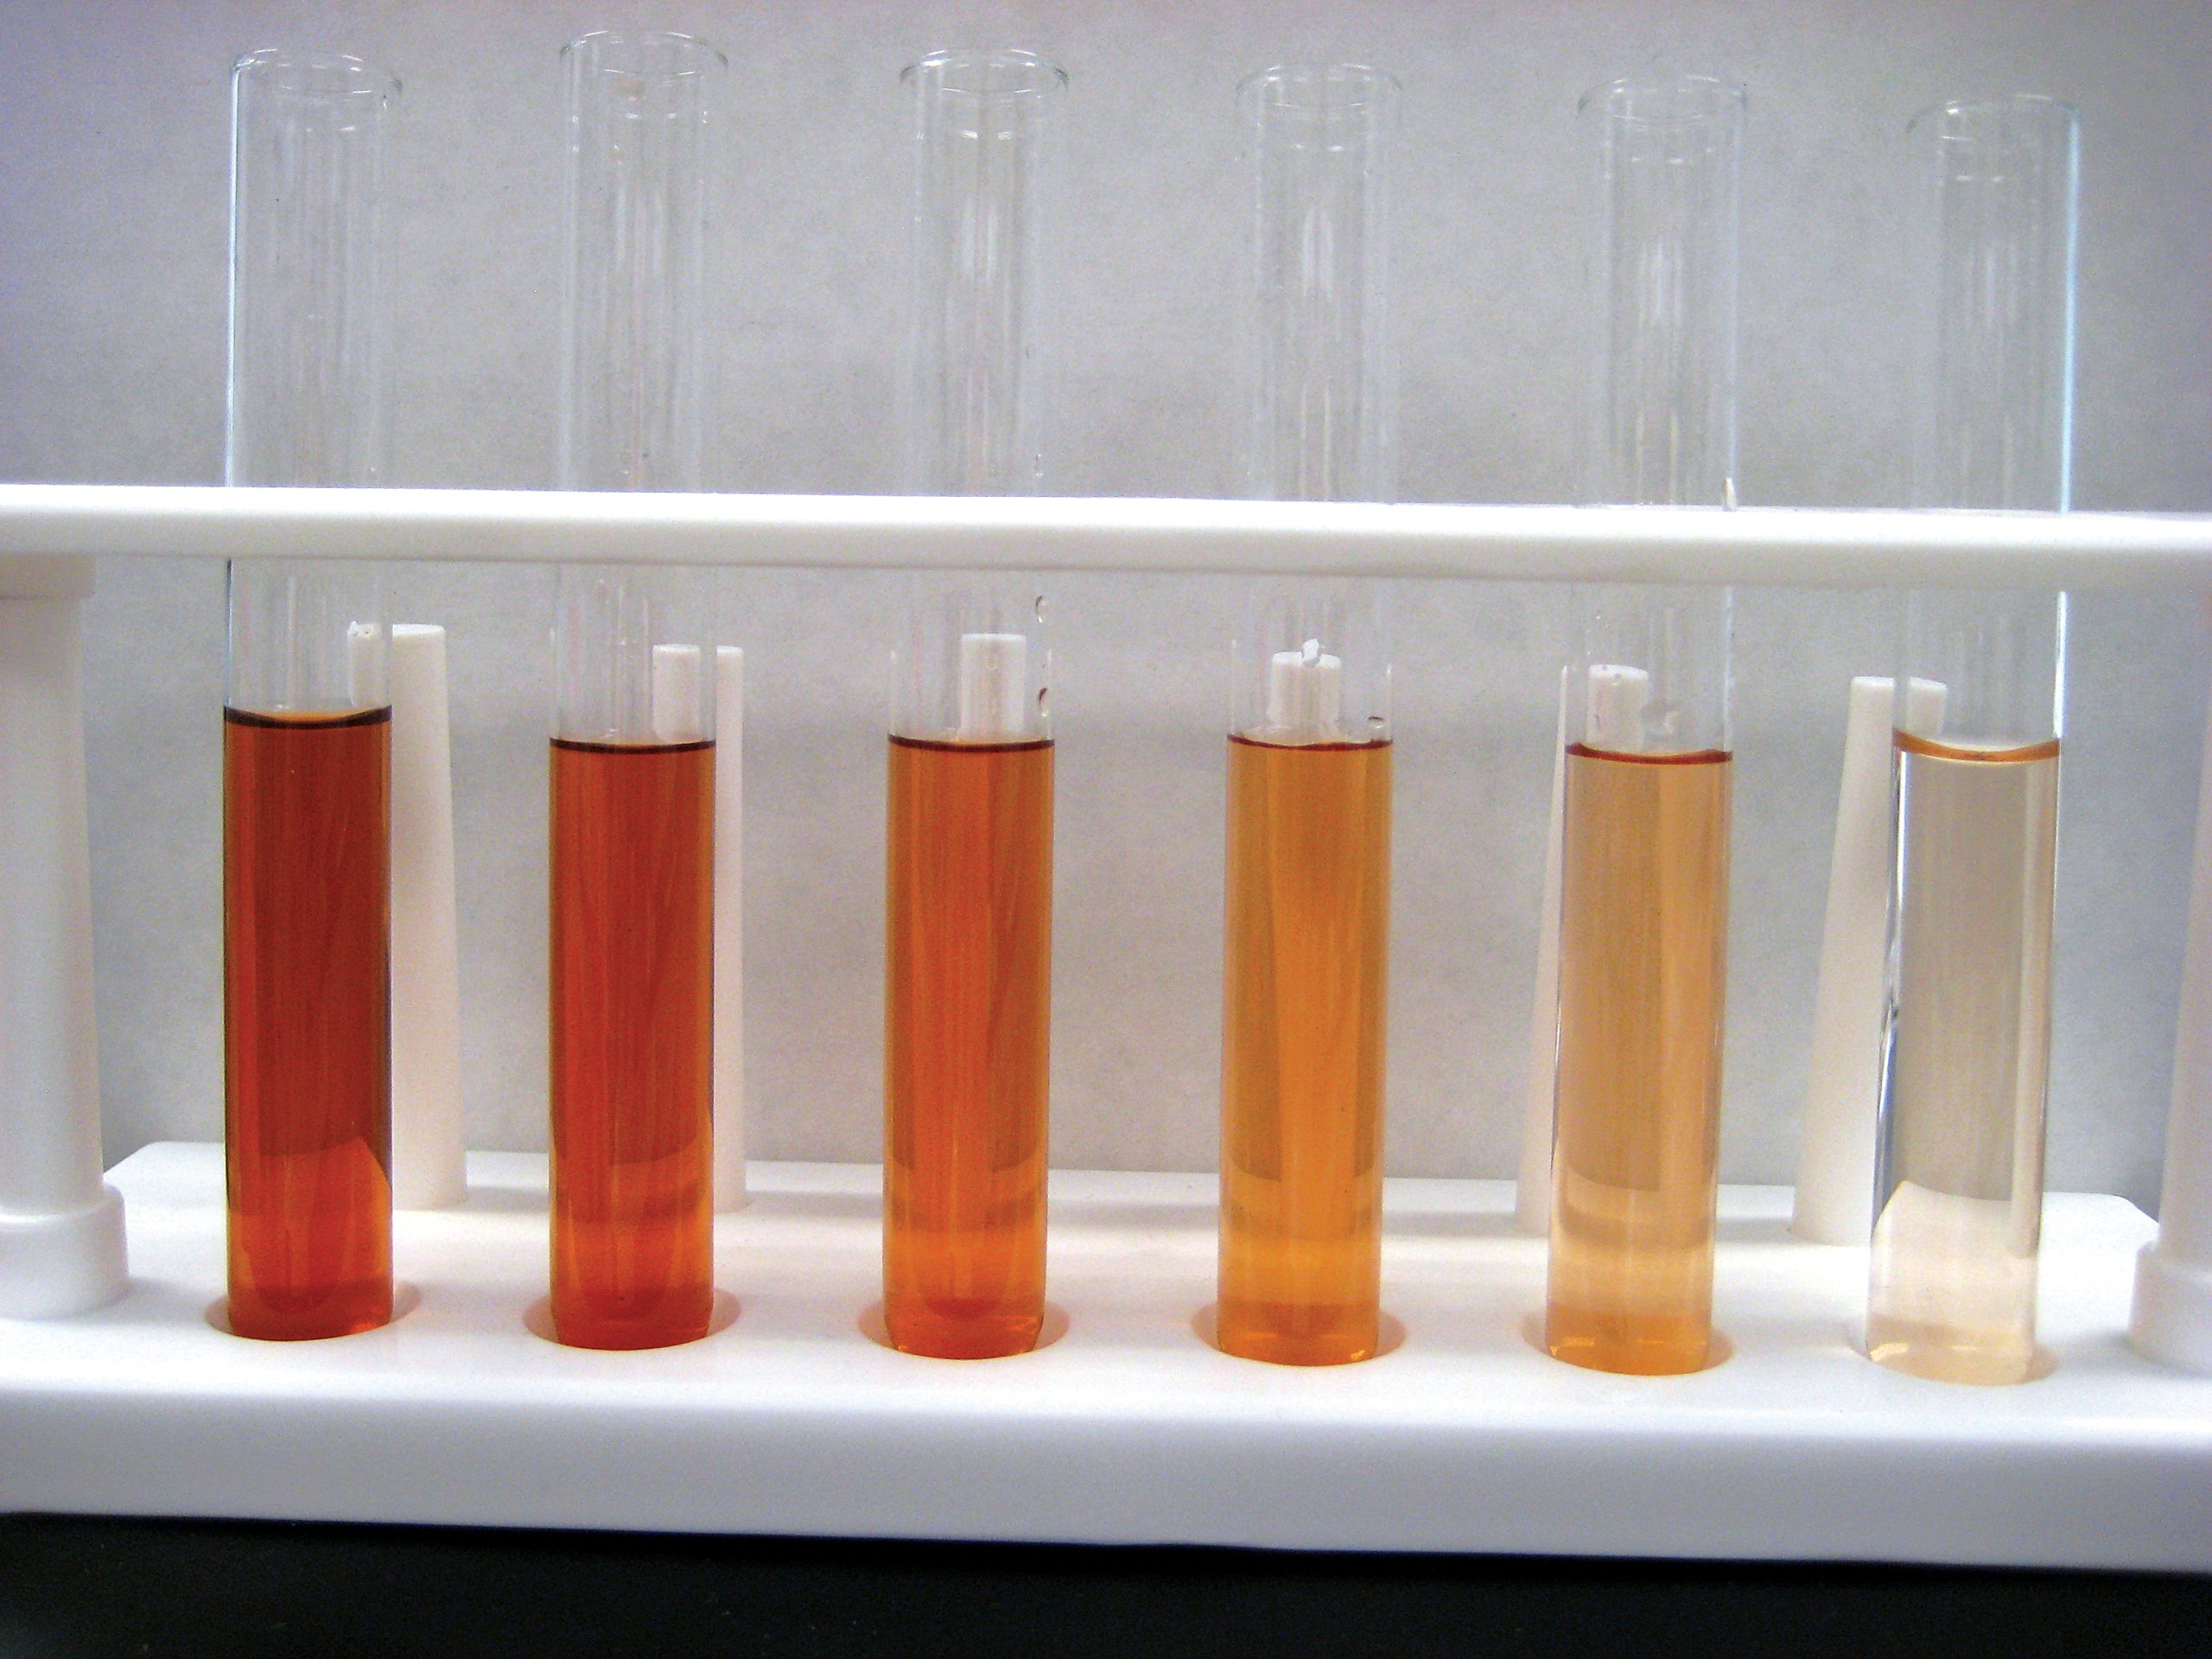
In this experiment, we will use an indicator for oxygen production. The compound guaiacol has a high affinity for oxygen, and in solution, it binds instantly with oxygen to form tetraguaiacol, which is brownish in color. The greater the amount of oxygen gas produced, the darker brown the solution will become. The color change can be recorded as a change in absorbency on an instrument called a spectrophotometer.
Exercise 1: Baseline reaction
First, you will establish the baseline reaction rate catalyzed by the peroxidase enzyme. The baseline is your standard for a reaction. If you later manipulate components of a reaction, you have a reference to help understand what occurred in the reaction.
- Download the Vernier Spectral Analysis app for your laptop or phone.
- Turn on the spectrometer by pressing the power button once—the power button is the small grey button on the front side of the device. The Bluetooth LED light will begin blinking.
- Launch the Spectral Analysis software on your phone or laptop.
- Click or tap Connect a Spectrometer. Select your spectrophotometer from the list of discovered devices. Your device’s ID is located near the barcode on the front label; you can start typing this ID into the search box to more easily find your device. When the app is connected to the spectrometer, the Bluetooth LED light on the device will glow blue and stop flashing.
- Click or tap Done to enter data collection mode.
- In the New Experiment dialog box, within Absorbance, choose “vs. Time (Kinetics)” to collect time-based data.
- A calibration will automatically begin when you select this experiment type. It can take 90 seconds or more for the lamp to illuminate fully. Wait for the warm up countdown to complete before proceeding with the calibration.
- While you are waiting, obtain three test tubes. Label one test tube with the letter B (blank), another with the letter E (enzyme), and the last with the letter S (substrate).
- The blank solution is an important control. You’ll use it to calibrate the spectrophotometer by providing a readout of the color of the solution that lacks the enzyme.
- Prepare the blank solution by filling the tube labeled B with:
- 1 mL (1000 µL) of pH 5 reaction buffer
- 500 µL of 0.02% hydrogen peroxide
- 250 µL of 0.2% guaiacol
- 500 µL of extraction buffer
- Mix the blank solution with a P1000 pipette (gently pipette up and down) and then transfer the blank solution to a cuvette. To correctly use cuvettes, handle cuvettes only by the top edge, and dislodge any bubbles by gently tapping the cuvette on a hard surface.
- When the lamp warm up is complete, insert the cuvette containing the blank solution into the SpectroVis unit with the clear sides aligned with the arrow (the white triangle) on the spectrometer.
- Click or tap Finish Calibration.
- Once calibration is complete, a screen that says “Choose a wavelength” appears where you will select the wavelength for our experiment. Enter 500 into the Selected Wavelength box to set 500 nm.
- Click or tap Done to use the wavelength you selected. If you made a mistake and need to return to the wavelength screen, click or tap the graph inset to change the wavelength.
- Prepare an enzyme solution by filling the tube labeled E with:
- 1 mL (1000 µL) of pH5 reaction buffer
- 500 µL of enzyme extract
- 500 µL of extraction buffer
- Prepare a substrate solution by filling the tube labeled S with:
- 500 µL of pH 5 reaction buffer
- 1 mL (1000 uL) of 0.02% H2O2 (hydrogen peroxide)
- 500 µL of 0.2% guaiacol
- Do the following as quickly as possible while being careful not to spill your reaction. Add the substrate solution to the enzyme solution and mix 2-3 times by pipetting up and down.
- Transfer ~2 mL of the reaction mixture to a cuvette (pour until the cuvette is about ¾ full) and place the cuvette in the spectrometer. Click or tap Collect.
- After you’ve recorded data for at least 2 minutes, click or tap Stop.
- Select the linear region of your data (the linear change should take place in the first ~100 seconds of data) by dragging across the graph over the time period you want to analyze. If needed, drag the boundary lines to resize the region.
- Click the Graph Tools button , select Apply Curve Fit, and choose the Linear curve fit. Click Apply.
- Record the slope of the line, m, as the rate of reaction, in abs/s and draw your results in your lab workbook.
- Discard the cuvette contents and other solutions down the drain and rinse out your test tubes.
Exercise 2: What factors impact the reaction rate?
Now that you’ve established your baseline, you can determine how a change in an environmental variable (pH) or reagent quantity (amount of enzyme) impact this reaction. Your group will choose ONE new variable to test.
Research Question: Write a research question that describes what factor your group has decided to investigate.
Research Rationale: Why does this research question matter? Discuss a real-world example where this factor’s impact on enzymes is important to understand.
Research Hypotheses: Formulate a hypothesis that attempts to answer your research question. Make sure your hypothesis includes a direction of the effect that you hypothesize will take place.
Predictions: (If…then…result): Write one prediction that supports your hypothesis, and another that refutes your hypothesis. Remember to write these as, “If (restate your hypothesis), then (manipulation of a variable), will result in (a specific measured outcome)” statements.
What are your Independent Variable (IV) and Dependent Variable (DV) for this experiment?
- When you use assay to investigate a factor that may impact enzyme activity, which reagents will you change? Which will you keep constant? Give your tubes informative names to identify their purpose.
- You will choose two new treatments to test and compare their reaction rates to your baseline reaction rate. For each new treatment, complete two replicates. You also need to repeat your baseline experiment one additional time to obtain two replicates.
- Record any other changes in protocol you are making in your investigation. After preparing your samples, repeat the experimental procedure from above.
- Note anything unusual or unexpected that happened during your experiment. Everyone makes mistakes in science, but acknowledging them with honesty is a key element of responsible research.
- Since the concentrations of the reactive materials in this laboratory are environmentally friendly (0.02% hydrogen peroxide and 0.2% guaiacol), they can be rinsed down a standard laboratory drain. Clean out all of your test tubes and leave them drying.
Conclusions:
- Create a graph in Excel to share your results with your class.
- Prepare a 1-2 minute mini-presentation to share your results with your peers during lab. Decide on who in your group will answer each of the following questions:
- What question did you try to answer?
- What approach did you use? (what did you change?)
- Describe your results. Explain what is shown on the x-axis and y-axis and then describe the trend. Point out anything noteworthy.
- End by stating the conclusion you can draw from your results (zoom back out and explain what you learned and why this matters)
