
10 DNA fingerprinting and phylogenetics
Intro to phylogenetics
Throughout this semester, you have studied genetics at multiple levels. From meiosis you know how, during formation of gametes, chromosomes are recombined, forming new allelic combinations that are distributed to gametes. From the principles of Mendelian genetics, you learned the properties of dominant and recessive traits, and the genetic relationships between these characteristics. You also learned how through sexual reproduction, new allelic combinations produce unique genotypes and different phenotypes across generations. By looking at your own family, and those of friends, you can observe how certain characteristics are carried through family lineages across many generations. This week’s lab applies all of these principles to a bigger picture, that of relatedness between organisms, both within a population and between species.
The fields of phylogenetics and molecular systematics work on the hypothesis that related organisms share DNA sequences in common (think heredity). Consequently, those organisms that are closely related share more similarity in genetic sequences than those that are more distantly related. The degree to which an organism’s DNA matches that of another organism provides evidence that these organisms arose from a common ancestor. The more closely the DNA matches between organisms, the more recently each diverged from their common lineage.
For such a vast concept, it’s really pretty simple. Just like your family shares a certain level of genetic similarity and appearance (with variation), so do individuals within each species share a certain genetic similarity and appearance. The reasoning for these similarities is rooted in the principles of genetics and heredity. The more related groups of organisms are, the more genetic similarity they share.
Modern laboratory methods allow us to identify specific genes in individuals and species. It has thus become possible to compare the presence of certain genes in one species to another. We can also compare the frequency of some allele in one population of a species to another population of that same species or even a different species. A simple definition of evolution is a change in allele frequency within a population over time. These changes in allele frequency lead to changes in physical appearance of that population, and often these changes serve some practical function for survival. These changes can take place over tens of thousands of years or just a few generations.
Today, you will use gel electrophoresis to separate and visualize DNA fragments in a Restriction Fragment Length Polymorphism (RFLP) analysis of samples taken from a “crime scene.” You will learn how to compare the genetic makeup of species and create a phylogeny, or evolutionary tree.
DNA Fingerprinting
If you’ve watched TV in the last decade, you have surely become all too familiar with the concept of matching crime scene DNA with a criminal suspect. The crime scene investigator steps out of their way too expensive for a crime scene investigator car, walks over and squats down next to a perfectly positioned dead body, squints at the victim, and picks up a hair or fiber or pen. Then they send the fiber or hair “to the lab” and the lab tech “runs the sample” and in about 22 minutes they find a perfect DNA match in the way too advanced for a crime lab computer. The CSI detective then goes and arrests the person and “dramatic confession, snarky remark, roll credits.”
So, that’s how it really happens, right? Sure, why not. But let’s talk about the real world, shall we? The truth is, most of the human genome is conserved throughout all people. This means the nucleotide sequence is the same for the vast majority of our DNA. However, there are certain areas scattered throughout our chromosomes where differences in nucleotide sequence have occurred. At these genetic markers, the genetic code is polymorphic (many forms) throughout the human race. Using these polymorphisms, geneticists can map a pattern within the genome of an individual that is unique to that person. This is what is known as a DNA fingerprint. The differences can be as simple as single nucleotide changes, called single nucleotide polymorphisms (SNPs) that are common at a particular locus, or more complex series of repeated nucleotides called short tandem repeats (STRs).
One of the first polymorphism patterns that was noticed in the human genome was the location of restriction sites. Many restriction sites are located in non-coding sections of DNA (not used to produce any protein product); therefore, small changes in nucleotide sequences (mutations) that occur in these regions have no detrimental impact on the individual, and so are not selected against. As generations pass, mutations accumulate between restriction sites and lead to different lengths of DNA between these sites for many individuals. Geneticists have identified a number of loci along the genome where the lengths of DNA between restriction sites are highly variable among individuals. By cutting the DNA with restriction enzymes at these sites we can thus produce DNA fragments of different lengths for different individuals. When these fragments of DNA are separated using gel electrophoresis, the pattern of fragments that is produced is called a Restriction Fragment Length Polymorphism (RFLP) analysis, or a DNA fingerprint. Gel electrophoresis is a technique used to separate DNA fragments according to their size. DNA samples are loaded into wells (indentations) at one end of a gel, and an electric current is applied to pull them through the gel. DNA fragments are negatively charged, so they move towards the positive electrode. By comparing the “bands” of DNA you observe in your sample compared to a DNA ladder (size marker) that contains DNA fragments of known size, you can determine the length of each DNA fragment in your sample.

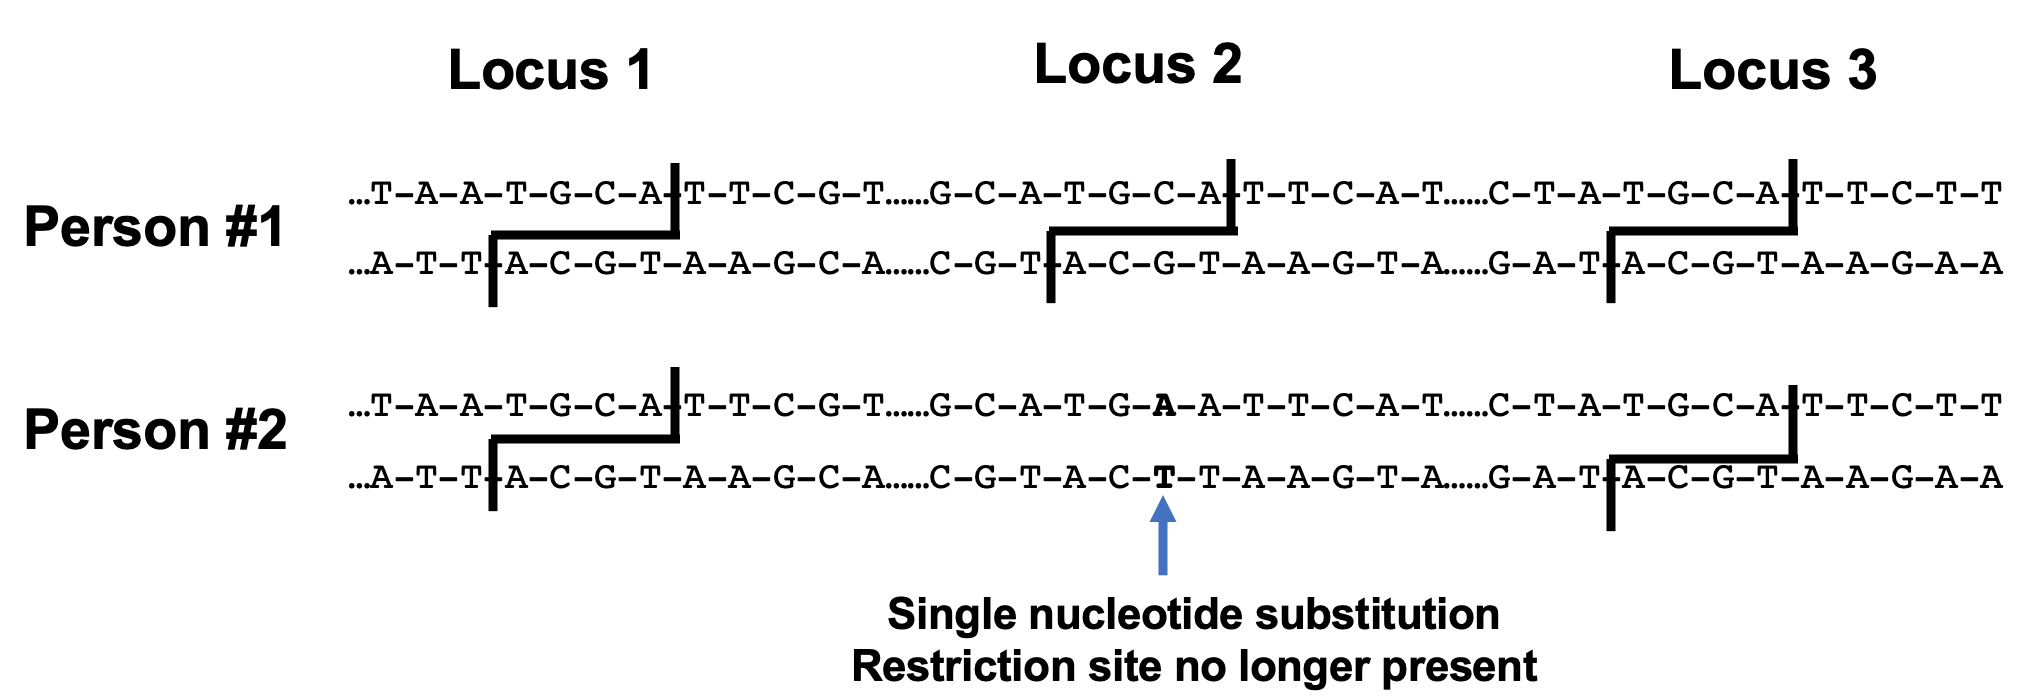
Take a look at the figure below. In these two nucleotide sequences from different individuals, restriction sites are formed by the palindromic sequences present at each marked locus. When the top sequence is cut with a restriction enzyme, two DNA fragments are created between sites 1 and 3. In the bottom sequence, restriction site 2 has been lost due to a single nucleotide substitution (in bold). The sequence is no longer palindromic and will not be recognized by a restriction enzyme. This results in a single, longer DNA fragment between restriction sites 1 and 3. When the fragments are separated using gel electrophoresis, the RFLP band pattern produced will differ between the two individuals.
Experiment 1. DNA Fingerprinting
Imagine that a murder has been committed. You arrive at the scene and collect blood samples that you will use to identify who committed the crime. The forensic lab reports that a blood sample you found does not match the victim’s blood, so you decide to conduct a RFLP analysis to determine who has DNA matching that from the scene of the crime.
You have managed to get your hands-on samples of DNA from three potential suspects and a sample of blood found at the original crime scene. Your forensic lab has extracted, purified, and digested the DNA with restriction enzymes. All that is left to do is separate the fragments and identify the culprit.
Procedure
Working in your teams, prepare and conduct a gel electrophoresis to identify the source of DNA in your unknown sample.
Pouring a Gel
- Get a gel tray (a cast) and close the open ends with masking tape.
- Make sure that your tape is smooth and tight to avoid agarose spilling onto the lab benches.
- Place a comb in the slots located closest to the end of the cast.
- SLOWLY and CAREFULLY pour hot agar into the cast until the level of agar is 3/4 of the way up the teeth of the comb.
- Let the gel sit and cool until cloudy and firm.
Loading the Gel
- Label four Eppendorf tubes for each of our DNA samples (1, 2, 3, 4).
- Obtain 10 µL of each digested DNA sample and add them to the appropriate tubes. Be sure to change pipette tips after every sample.
- Your loading dye is at 6X concentration. Calculate how much loading dye you need to use to obtain a final concentration of 1X loading dye when you add the dye to your DNA samples.
- After the gel has cooled, remove the tape and gently remove the comb. Notice the wells that are created by the comb.
- Place the gel/gel tray into the gel box and slowly pour in enough TAE buffer to just fully cover the gel. It may help to fill one side of the box and then the other. The surface of the gel should look completely smooth. Check that the wells are entirely submerged in buffer.
- Using the P10 micropipette and new tips, load each sample into the gel wells. Each person will pipette 6 µL TWICE to transfer the entire 12 µL sample into the well.
- This must be done carefully. If you don’t get the samples into the wells, or if you gouge or tear the gel, the samples will not run correctly. Use one hand to stabilize the pipette while you press the plunger with the other hand.
- Load samples from left to right in the following order: skip the first well, then load your samples.
- Place the lid on the gel box and connect to the power supply box.
- Make sure you properly match up the red and black connections.
- Turn on the power supply box and set the voltage to run at 100 V (low range).
- Gels will run for about 45 minutes. After the gels run, TURN OFF THE POWER SOURCE before removing the gel box lid.
- Using gloves, remove the lid from the gel box, carefully remove your gel and place it in the black light box to view. We will do this last step as a class.
Viewing and Interpreting the Gel
Draw the results of your team’s gel in your Student Workbook. Be sure to label the identity of each sample, and draw the pattern created by each set of DNA bands. Then state a conclusion as to which suspect matches the DNA found at the crime scene. Cite the banding pattern in the gel as evidence to support your conclusion.
Experiment 2. DNA Sequence Alignments and Phylogenetics
COVID-19 is caused by a virus known as SARS-CoV-2 that enters our cells and uses cellular machinery to build new viruses. To enter a cell, the virus requires ACE2—a protein found on the outer surface of cells. A viral protein attaches to the human ACE2 receptor protein and this triggers the entry of the virus. You may have heard that other animals such as tigers and dogs can occasionally get COVID-19. This raises the hypothesis that these animals have similar ACE2 receptors as humans. Scientists have published the DNA, RNA, and protein sequences for ACE2 from many different species. We’ll perform a technique known as a sequence alignment in order to compare sequences from different animals and evaluate their similarities. This technique is essential in learning which genes are conserved across different species, and for evaluating the evolutionary relationships between different species.
Procedure 1: Manual Sequence Alignment
First, we will compare a small section of the Ace2 gene from a dog and human. Use the sequence data in your lab workbook to calculate the percent similarity between these nucleotide sequences for this gene. Then answer the questions in your Student Workbook. You’ll then manually compare Ace2 genes from several different species and construct a table to see how similar they are.

Procedure 2: Sequence alignment on a computer
Comparing only a short sequence within one gene is not sufficient in determining which organisms are most closely related. More accurate phylogenies can be determined by comparing longer sequences and by comparing the alignments of multiple genes across species. We will first perform a pairwise alignment to compare dog and human ACE2 DNA sequences. Follow the procedure in your Student Workbook. You’ll use a computer program called BLAST to align your sequences.
Procedure 3: Construction of a phylogenetic tree on a computer
Scientists often compare many different sequences to explore evolutionary relatedness and determine which species or genes are most closely related to each other. We will perform a multiple alignment to compare ACE2 PROTEIN sequences from many different animals. This will allow us to determine if ACE2 is conserved across species and make initial predictions for which species may be susceptible to this virus. Phylogenetic trees are built by calculating the ‘genetic distance’ between sequences and using these changes in nucleotides as a metric to determine how closely related species or genes are to each other.
