3 Dilutions, Pipetting, and Graphing
Introduction to molecular biology techniques and data analysis skills
Everyone who works in a biology laboratory must know how to make accurate dilutions – whether of chemicals or microbes. For example, a concentrated stock solution must be diluted prior to adding it to a reaction mixture in a test tube. In this activity, you will learn about (i) units of measurement, (ii) dilutions and (iii) how to use micropipettes.
Exercise 1 – Dilutions and Micropipetting
In molecular biology labs, we use volumes in the range of microliters (μL) to liters (L). Let’s review our metric prefixes:
Liter, L = 1
Milliliter, mL = 0.001 L or 1×10⁻³ L (There are 1000 mL in 1 L)
Microliter, μL = 0.000001 L or 1×10⁻⁶ L (There are 1000 uL in 1 mL)
Working in a biology lab involves doing many unit conversions to make sure you use the correct volumes in your experiments. Algebra is a key part of careers in research and medicines. For example, anesthesiologists are responsible for doing unit conversions to ensure they deliver the correct amount of drug to their patients. So let’s practice the key math skills you’ll use all semester!
For example, if a bottle contains 1 mL (milliliter) of water and you need to know how many μL this is, you would use the equation:
1 mL * (1000 μL/1 mL) = 1000 μL
Make sure your units cancel out: the mL in 1 mL cancels out the mL in the denominator, so you are left with the unit you want to solve for (in this case μL). Writing out your unit conversion equation ensures you don’t make a silly mistake. In molecular biology, milliliters (mL) and microliters (μL) are our most common units of measurement. Make sure you don’t mix these prefixes up!
Solutions are often supplied as concentrates (also called stock solutions) that have to be diluted before use. Stock solutions are given names that refer to how concentrated they are. For example, a stock solution that is 10-fold concentrated is known as a 10X solution. A 10X solution needs to be diluted 10-fold to a 1X solution prior to use. If you’ve ever bought orange juice concentrate and diluted it in water, you’ve performed these steps! This activity will show you how to accurately calculate and perform dilutions.
To calculate a dilution, you use the formula:
Example: To perform a reaction, you need to dilute your stock solution in water. If you have a 10X stock solution and need 100 μL of a 1X solution, the calculation would look like this:
First, define what values you know and what you are trying to determine:
- C1 = 10X (stock concentration)
- V1 = ? (this is the value we will calculate)
- C2 = 1X (our desired final concentration)
- V2 = 100 μL (our desired final volume)
Next, plug these values into C1 * V1 = C2 * V2
- 10X * (V1) = 1X * 100 μL
- V1 = 10 μL of stock solution needed
Finally, calculate how much water you need to dilute the stock solution to achieve the desired final volume (100 μl)
- To make the dilution, 10 μl of stock solution is added to 90 μl of water to obtain the final volume of 100 μL, as demonstrated in the below:
- Volume of H20 = final volume (V2) – stock volume (V1)
- Volume of H20= 100 uL – 10 uL
- Volume of H20= 90 uL
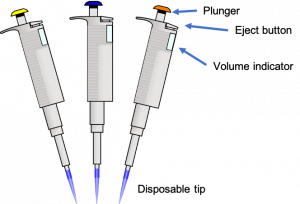
To transfer small amounts of liquid, molecular biologists use micropipettes, which measure microliter (μL) volumes. Remember that 1 milliliter (mL) = 1000 μL. We use different micropipettes to measure different volume ranges; always check your pipette since different companies make pipettes that vary in their range. The pipette name is the largest volume it can measure with the letter ‘P’ added. Common pipette sizes and their volume ranges include:
P10: 0.5 μL – 10 μL
P20: 2 μL – 20 μL
P100: 10 μL – 100 μL
P200: 20 μL – 200 μL
P1000: 100 μL – 1000 μL
How to use a micropipette:
- SELECT the correct size micropipette for the volume you need.
- SET the micropipette to the appropriate volume by adjusting the dial. Set the volume only within the range specified for that micropipette. It is only accurate in this range and damage occurs when it is set beyond the minimum or maximum. Pipettes only work in one direction. They will not turn around back to zero after turning to the highest number; the direction must be reversed to return to lower numbers.
- PLACE a clean, disposable tip on the micropipette by gently pressing the pipette onto a tip in the tip box. Use a new disposable tip every time you change solutions. The small tips are for a P10 only, the medium tips fit a P20/P100/P200, and the large tips are for a P1000.
- PRESS the plunger down to the first stop and hold. The first stop is the first point at which you feel resistance as you press down on the plunger. The plunger will NOT be fully depressed at the first stop.
- INSERT the tip beneath the surface of the liquid you want to pipette. Eye level pipetting allows you to see the liquid moving and ensures accuracy. Only put the tip in as far as necessary to pipette your desired volume.
- TRANSFER liquid up into the micropipette tip by slowly releasing the plunger. Control the speed at which the plunger rises with your thumb. Releasing the plunger too quickly will cause bubbles that make the measurement inaccurate. Keep the micropipette in a vertical position when there is fluid in the tip; otherwise, liquid can enter and damage the pipette.
- DISPENSE liquid by touching the tip to the inside wall of the reaction tube into which you want to unload the sample. Then, press the plunger to the first stop. Touching the wall of the tube creates a tiny surface-tension effect, which helps the drop of fluid transfer from the tip to the tube.
- EXPEL any remaining liquid by pressing the plunger to the second stop. The second stop is used only to push out any last remaining drops from the tip.
- REMOVE the tip from the sample drop (pull away from the tube) before releasing the plunger. Releasing the plunger too soon will suck up liquid from your sample, causing error.
- DISCARD the tip by pressing the ejector button. Change tips before you pipette into a new solution. Tips can be reused if you are transferring the same solution into clean, empty tubes.
Pipettes are expensive and can be easily damaged. As you are pipetting:
- NEVER use the micropipette without a disposable tip in place. Moisture can damage the micropipette and reduce accuracy.
- NEVER lay a liquid loaded micropipette down. Moisture can run back inside causing damage to the micropipette.
- Do not allow the button to snap back after pushing the plunger. Allow it to return gradually.
- Make sure you are using the correct pipette. When learning how to pipette, people often use the P200 set to 10.0 μl instead of the P1000 set to 100 μl, or use the P20 instead of the P200. Double-check the volumes listed on the side of the pipette before drawing up liquid.
- Remember that you only push all the way to the second stop when you are expelling the last drop of liquid. When you pull up liquid, only the first stop is used.
Watch this video to learn how to pipette:
Exercise 1: Procedure
You have been provided food dye as a 10X stock solution that must be diluted to 1X. The table in your Student Workbook provides the final volume of 1X dye desired. Using the C1*V1=C2*V2 formula, calculate the volumes of 10X dye and water needed to perform these dilutions and complete the table. Then make dilutions of each by mixing the dye and water in appropriate volumes. The color of your solution can be used to assess your pipetting accuracy.
Exercise 2: Creating graphs in MS Excel
How you represent data in a graph depends on the type of data and what effect you want to show. If you want to show a trend over time, it makes sense to use a line graph; if you are comparing counts or the responses of different treatment groups, a column (bar) graph is usually best.
Graph tips
- The vertical axis is called the y-axis, and the horizontal axis is called the x-axis.
- The x-axis (usually) represents whatever variable you are testing or changing in your experiment (the independent variable, IV).
- The y-axis (usually) represents what you measured as an outcome in your experiment (the dependent variable, DV).
- The order of your columns/rows and their contents (numbers versus words) affects how Excel creates a graph. For example, if you highlight two columns and the first column contains words and the second column numerical values, Excel assumes that the first column contains your x-axis values (IV) and the second column contains your y-axis values (DV). If you have a complex dataset, you often have to correct the default graphs created by Excel by using the Select Data button to select your x and y-axis values.
Key elements of a figure
A figure isn’t just numbers, titles, and lines. For a figure to be meaningful, every figure needs the following.
- Axis labels. The number 10 doesn’t mean anything if you don’t indicate what is being counted (e.g., minutes, babies, wavelengths, etc.).
- Axis labels must include units. (e.g., mg/liter for concentration, #/second for rate of change)
- A complete and descriptive figure caption. Underneath the figure, label the figure as follows:
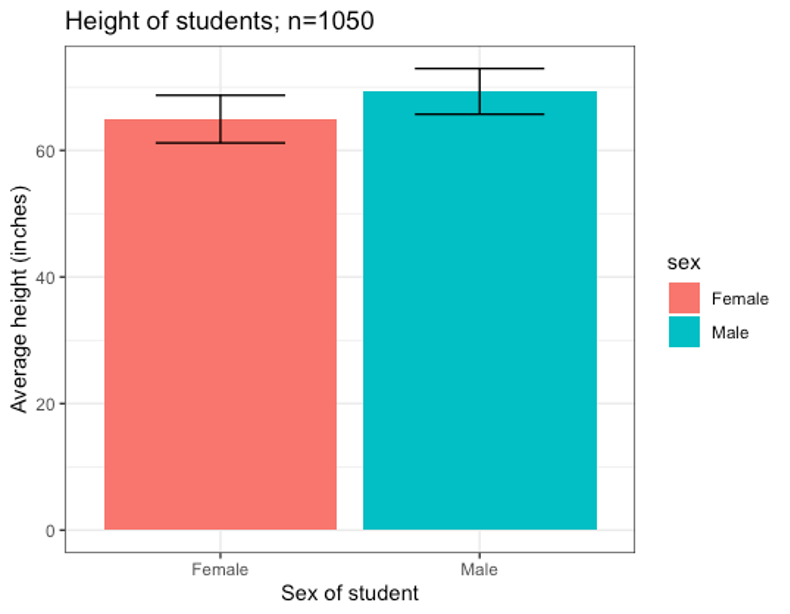
Depicting variation on a graph with error bars
Most data summaries, whether in the form of a Table or a Graph use averages (arithmetic mean) or medians to depict the outcomes of an experiment. These calculations help scientists note where the “central tendency” lies within a dataset. In other words, they show scientists where the “middle” of the outcome values measured within a set of replicates (repeated treatments within an experiment) resides. By comparing average outcomes from several experimental treatments, scientists can determine what effect our independent variable has on our dependent variable. However, to more completely evaluate hypotheses, we need to show more than just the average values in each sample set. We also need a way to depict the variation of our data.
One way of depicting variation within a set of values is to show the standard deviation of the dataset as error bars on our graphs. A low standard deviation means that our data points are close to the mean of the set, while a large standard deviation means that our data points are spread out over a wider range of values. Depicting this value on a graph as error bars reveals the amount of variability within our results. This variability can be used to estimate the reliability of certain data, infer causality between variables and measure the confidence of statistical conclusions. Variation is often depicted as “whiskers” ranging above and below a mean value on a graph.