
7 Photosynthesis
Intro to Photosynthesis
All life relies on energy to perform metabolic functions. Heterotrophic organisms, such as animals, fungi, and some protists gain this energy by consuming parts or the whole of other organisms. Autotrophic organisms, like plants, some bacteria, and some protists, gain this energy by converting inorganic (non-carbon containing) chemicals (chemoautotrophs) or sunlight (photoautotrophs) into useable forms of energy. Chemoautotrophs are thought to have been the earliest organisms on earth, and are present today (e.g., sulfur-oxidizing bacteria). Photoautotrophs (photosynthetic organisms) capture the energy in sunlight and use it to power the production of adenosine triphosphate (ATP) and organic molecules like glucose. The process of photosynthesis is a complex series of enzyme-mediated steps, and the exact process differs between organisms. In this lab we will focus on the type of photosynthesis that is carried out by plants.
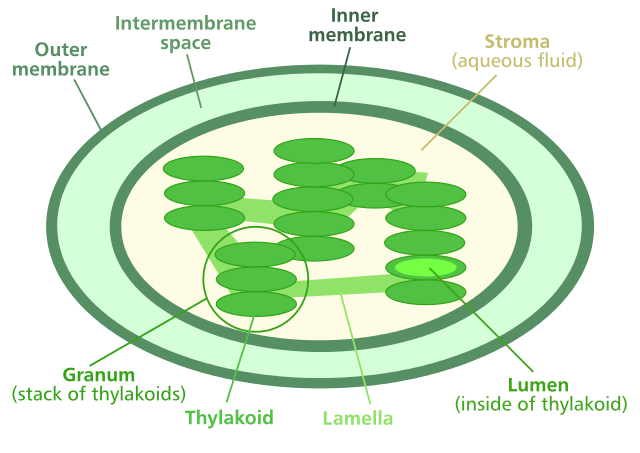
The organelle that is responsible for photosynthesis in plants is the chloroplast. Chloroplasts consist of a double external membrane which houses internal membrane structures called thylakoids. Each thylakoid consists of a phospholipid bilayer membrane with proteins and pigment molecules suspended within it. Inside the thylakoid is an open area called the thylakoid space. Outside the thylakoids is a semi-liquid matrix called the stroma. The thylakoids exist within the stroma as stacks called grana (singular, granum). Think about this: if you had a stack of pita bread in a lunch sack, the sack would represent the outer membrane of the chloroplast. Each pita would represent a single thylakoid, and the space inside the pita is the thylakoid space. The area between the pitas and the lunch sack would represent the stroma, and the stack of pitas would be a granum. The proteins and pigments responsible for carrying out photosynthesis would be suspended in the bread of each pita.
Photosynthesis in plants takes place in two sets of reactions: the light-dependent reactions and the light-independent reactions. The light-dependent reactions rely on a constant input of light energy in order to proceed. These reactions are carried out by complexes of proteins and pigment molecules called photosystems, and two series of enzymes called electron transport systems (ETS). The first step in this process takes place when light energy is absorbed by the pigment molecules in photosystem 2 and water molecules are enzymatically split (hydrolysis) to harvest their electrons. The light energy is stored “in” these electrons, which are then passed through the first ETS. The waste product of the hydrolysis reaction is oxygen gas. In fact, most of the oxygen in the earth’s atmosphere was produced (and still is) during this first step in the process of photosynthesis.
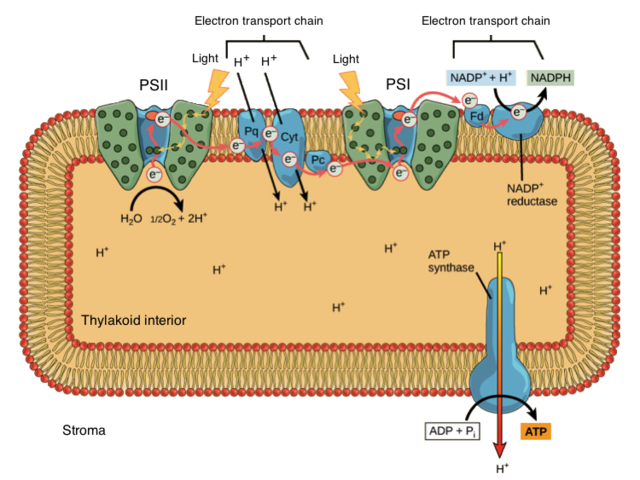
Within the first ETS, energy from the harvested electrons is used to pump hydrogen ions into the thylakoid space (lumen), producing a concentration gradient between the thylakoid space (lumen) and the stroma. The hydrogen ions diffuse out of the thylakoid space through the enzyme ATP synthase, which uses this motive force to build ATP molecules in the stroma. The electrons are passed from the first ETS to photosystem 1, where more light energy is added to them. Photosystem 1 passes the electrons to the second ETS, where the electrons are combined with NADP+ and hydrogen ions from the stroma to produce the electron carrier molecule NADPH.
Ignoring quantities, the light-dependent reactions can be summarized in the chemical equation:
The light-independent reactions take place within the stroma and use the products of the light-dependent reactions (ATP and NADPH) to build organic molecules. In these reactions, carbon and oxygen atoms are harvested from carbon dioxide, energy is extracted from ATP, and hydrogen atoms are taken from NADPH. All of these are combined in a series of enzyme-mediated reactions to produce a sugar molecule. When this process is completed six times, the result is the production of a single glucose molecule. In other words, for every six molecules of carbon dioxide used up, one molecule of glucose is formed.
Ignoring quantities again, the light-independent reactions can be summarized in the chemical equation:
If we combine the light-dependent and light-independent reactions, the balanced chemical equation for photosynthesis is:
The Role of Pigments in the Light-dependent Reactions
Light energy exists in the form of packets of energy called photons, which physics tells us have the properties of both waves and particles. As such, different photons of light carry different levels of energy, and oscillate at different wavelengths. We perceive these different wavelengths as colors. White light consists of all of the wavelengths that the human eye can see. When we see a rainbow, we are seeing the separation of white light into its component wavelengths due to refraction through water droplets in the air, which act like a prism. Together, all of these wavelengths are called the white light spectrum. The white light spectrum is part of a larger continuum called the electromagnetic spectrum. Electromagnetic energy ranges from extremely short wavelength, high energy radiation like gamma rays through long wavelength, low energy radiation like radio waves.

The initial capture of light energy during photosynthesis is accomplished by photosynthetic pigments. Pigments, put simply, are molecules that can absorb light energy. Different pigments absorb light energy at different spectra or wavelengths. For example, green pigments like chlorophylls absorb energy from blue and red wavelengths of light but reflect green wavelengths. Therefore, our eyes perceive these pigments as green. The primary pigment in plants is chlorophyll a. Plants may also contain other pigments such as xanthophyll, carotene, anthocyanin, and chlorophyll b. Each of these pigments absorbs light energy at slightly different spectra and they are collectively called accessory pigments. Production of accessory pigments allows a plant to absorb more light energy than chlorophyll a can absorb alone.
Experiment 1: Pigment Chromatography
Not only do different pigment molecules appear as different colors, they also differ in size. We can separate molecules of different sizes using chromatography. Chromatography is a collective set of procedures used to separate mixtures into their components. The mixture is first dissolved in a solution (called the mobile phase) that is drawn through or over a medium (called the stationary phase). The mixture components have different affinities for the mobile and stationary phases (due to molecular size, charge, density, polarity, etc.) and separate into groups of like types. Chromatography was first employed by Russian botanist, Mikhail Tsvet in the early 1900s to separate plant pigments. Over the years, many methods and media have been developed for chromatography of different mixtures. In Experiment 1, we will use paper chromatography to separate photosynthetic pigments from plant extracts. Paper chromatography uses filter paper as the stationary phase and a liquid solvent as the mobile phase.
If you look at the leaves of most plants during the summer, they most often appear green. Later, during autumn, those same leaves may appear red, orange, yellow, or even blue. Where did the green go? Where were the other colors during the summer? During the spring and summer, chlorophyll masks the accessory pigments present in the leaves. In the fall, cooler temperatures cause the trees to stop producing chlorophyll, so the reds, yellows, and other colors show through; but they’ve been there the whole time. Is this true? It was written in a textbook, so it must be true; right? Well, one of the greatest strengths of science is that previous findings are always open to scrutiny, correction, and adjustment based on new data. We will investigate the pigments found in a variety of plant samples in Experiment 1. We will use spinach as a reference for identifying some of the pigments.
Experiment 1: Paper Chromatography of Pigments
Procedure
- Obtain your team’s plant samples and crush them into small pieces. Discard any fibrous veins.
- Prepare a pigment slurry by crushing the plant sample with a mortar and pestle, adding enough ethanol to make the slurry into a thin watercolor-type paint consistency.
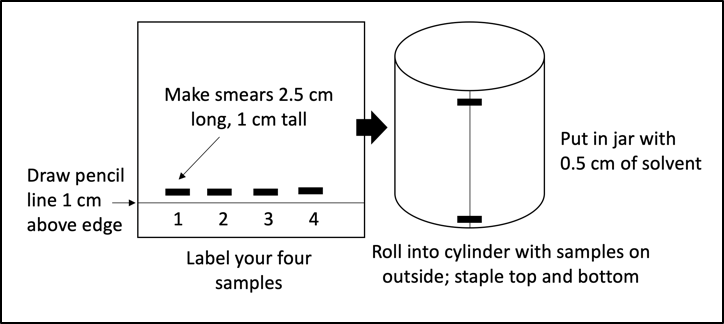
- Obtain one piece of chromatography paper and draw a pencil line along one long end about 1 cm from the edge.
- Label your paper with your four sample identifiers as column names.
- Using a Q-tip, apply the appropriate pigment slurries just above the line so that you create a smear about 2.5 cm long and 1 cm tall for each sample. Your papers should look like Figure 7.1. Apply the slurry onto the chromatography paper at least four times and dry the paper between applications.
- Once you have a nice, dark smear for each plant sample, roll the papers into cylinders and staple them at the top and bottom (Figure 7.1).
- After creating your chromatography columns, place them into the chromatography jars. Each jar should contain about 0.5 cm of solvent. We will use two types of solvent for this experiment; a non-polar chromatography solvent (petroleum ether + acetone) that must be kept in the chemical hood, and a polar “universal solvent” we like to call water. Your instructor will inform you which solvent your group is using. Important: Students who are or might be pregnant should avoid the solvent fumes in this lab.
- Cap each of your chromatography jars and let them sit for about 40 minutes. You will see the solvent wicking up the paper. Depending on the molecular size of each photosynthetic pigment and the affinity each has for the solvent, the pigments will separate on the chromatography paper.
- After the pigments have separated, remove the papers from the chromatography jars, flatten them out, and allow them to dry.
- We will compare the results of our samples to answer our research question.
Experiment 2: Structural Integrity in Chloroplast Membranes
True story: NASA plans to send a manned expedition to Mars in the 2030s, and the journey is expected to take several years to complete. The astronauts might even establish a manned research base on the planet. The spacecraft won’t be able to carry enough food for years of space travel and residence on the planet, so NASA (along with universities around the world) is developing technology to grow food in space. In fact, right here at BSU, research is being done on the effect of microgravity on cell development and gene expression! One problem, however, is that we don’t know how prolonged space travel (and microgravity environments) will affect the cells of plants. Will plant cells orient themselves correctly to maximize photosynthesis? Will cell membranes and enzymatic associations remain intact without the directional effects of gravity? Other potential issues are the unknown effects that radiation (without the shielding effects of the earth’s atmosphere) will have on cell membranes and the organelles inside them. Will cell membranes degrade? Will chloroplasts still carry out photosynthesis?
In Experiment 2, we will explore an important question that has arisen from this scenario. That is: How important is membrane structure to the process of photosynthesis? Think about these related questions. Is a chloroplast merely a bag of photosynthetic pigments and enzymes? Could NASA get around all of these issues by simply placing the necessary components into a test tube and get photosynthesis?
As you know, photosynthesis is a very complex process of enzyme-mediated chemical reactions. For this procedure, we will test the effect of membrane disruption on the light-dependent reactions of photosynthesis. We will measure the amount of photosynthesis taking place using DCPIP. DCPIP is a dye that absorbs electrons. In its normal (oxidized) state, DCPIP is dark blue. When it absorbs electrons (i.e., it is reduced), DCPIP turns colorless. If photosynthesis is taking place within our experimental treatments, the DCPIP should intercept electrons released from photosystems 1 and 2 before they can be transferred to NADP+. Therefore, loss of blue color in our treatments will indicate the amount of photosynthesis that is taking place.

We can quantify the color change of DCPIP using a spectrophotometer. A spectrophotometer is a machine that broadcasts light through a liquid and measures the amount of energy absorbed at certain wavelengths. Unreduced DCPIP (blue) absorbs light energy at a wavelength of 620 nm. By measuring the level of spectral absorbance in each treatment solution, we can quantify the amount of unreduced DCPIP that is left, and thus rank our experimental treatments by the amount of photosynthesis that has occurred. A high amount of spectral absorbance indicates that there is a lot of DCPIP left unreduced in solution. This means that the DCPIP has not intercepted many electrons and therefore equates to a low amount of photosynthesis going on. In the same manner, a low amount of spectral absorbance equates to a high amount of photosynthesis having taken place.
For our experiment, we will use chloroplasts extracted from spinach leaves. The extraction takes about 45 minutes of preparation, so in the interest of time, your instructor has already obtained the chloroplasts. We will begin our experiment with whole chloroplasts suspended in an isosmotic buffer, and lysed chloroplasts that have been burst in a hypoosmotic (hypotonic) buffer. In the lysed treatment (lysed means broken) the chloroplast outer and inner membranes have burst, but the thylakoids are still intact.
Our research question for this experiment is: What is the effect of chloroplast and thylakoid membrane disruption on the processes of photosynthesis?
Procedure
- As a team, label five experimental tubes as treatments A, B, C, D, and E.
- To each tube, add the appropriate volumes of each material following Table 7.2. Be sure to wrap Treatment B in aluminum foil before adding any of the materials.
Table 7.2 Treatment setup for determining the importance of membrane integrity on the processes of photosynthesis. Follow the “recipe” to set up each treatment. Note that component volumes change for different treatments in order to keep chloroplast and DCPIP concentrations constant.
| Treatment | Chloroplast solution | 0.1 M PO4 buffer | Additional reagent | DCPIP | Description |
| A – Light | 0.5 mL | 3 mL | 1.5 mL dH2O | 1 mL | Intact chloroplasts exposed to light. |
| B – Dark | 0.5 mL | 3 mL | 1.5 mL dH2O | 1 mL | Intact chloroplasts kept in the dark. |
| C – Lysed | 0.5 mL (lysed) | 3 mL | 1.5 mL dH2O | 1 mL | Chloroplasts lysed by osmotic stress. Thylakoids remain intact. |
| D – Detergent | 0.5 mL | 4 mL | 0.5 mL 20% Triton X-100 | 1 mL | Detergent dissolves lipid membranes. Enzymes and pigments remain unchanged. |
| E – Control | None | 3 mL | 2 mL dH2O | 1 mL | No chloroplasts. |
| Key points to consider:
● What is the purpose of the treatment with no chloroplasts? ● Why is it important to place all treatments at the same distance from the lamp? ● Why are we combining data from all groups to reach our conclusions? |
- Once you have set up each treatment, place them all under a lamp for 20 minutes (keeping treatment B covered). Be sure to place each tube at the same distance from the lamp.
- After 20 minutes, pour about 2.5 mL of each treatment solution into a cuvette.
Determine the absorbance of your samples at 620 nm by completing the following steps:
- Download the Spectrovis app for your laptop or phone.
- Turn on the spectrometer by pressing the power button once—the power button is the small grey button on the front side of the device. The Bluetooth LED light will begin blinking.
- Launch the Spectral Analysis software on your phone or laptop.
- Click or tap Connect a Spectrometer. Select your spectrophotometer from the list of discovered devices. Your device’s ID is located near the barcode on the front label; you can start typing this ID into the search box to more easily find your device. When the app is connected to the spectrometer, the Bluetooth LED light on the device will glow blue and stop flashing.
- Click or tap Done to enter data collection mode.
- Select Absorbance and then choose “vs Concentration (Beer’s Law)” from the New Experiment dialog box.
- A calibration will automatically begin when you select this experiment type. It can take 90 seconds or more for the lamp to illuminate fully. Wait for the warm up countdown to complete before proceeding with the calibration
- While you are waiting, prepare a “blank” cuvette by filling a cuvette ¾ full with diH2O (our solvent for the experiment). When the lamp warm up is complete, insert the blank cuvette into the SpectroVis unit with the clear sides aligned with the arrow (the white triangle) on the spectrometer.
- Click or tap Finish Calibration.
- Once calibration is complete, a screen that says “Choose a wavelength” appears where you will select the wavelength for our experiment. Enter 620 into the Selected Wavelength box to set 620 nm as our wavelength.
- Click or tap Done to use the wavelength you selected. If you made a mistake and need to return to the wavelength screen, click or tap the graph inset to change the selected wavelength.
- Our independent variable (shown on the x-axis) is not concentration. Click or tap ••• next to the table column heading that says Concentration and select Column Options to change the column name and units. Change the column name to Treatment and leave the units box blank (since our treatment groups do not have units).
- When you are ready to analyze your samples, fill each cuvette ¾ full of treatment solution, then place the cuvette in the SpectroVis unit. Make sure the clear sides of the cuvette are aligned with the white arrow on the spectrometer.
- Click or tap Collect to start data collection. This enables the Keep button.
- Click or tap Keep when the reading has stabilized. Higher absorbency values mean more light is being absorbed by a sample.
- Leave the treatment box blank then click or tap Keep Point to record your data in the data table. Your samples will be sequentially numbered in the table as shown below:
- Continue collecting data for your different samples until you have collected all of your data points.
- Turn off the spectrophotometer by holding down the power button for ~3-4 seconds.
- Complete Table 7.3 with your team’s results, and enter these into the class data spreadsheet.
- Use the class data to rank each treatment by amount of photosynthesis that has taken place, and create a graph comparing the absorbance of each treatment solution. Plot the average absorbance +/- SD as a column graph.
